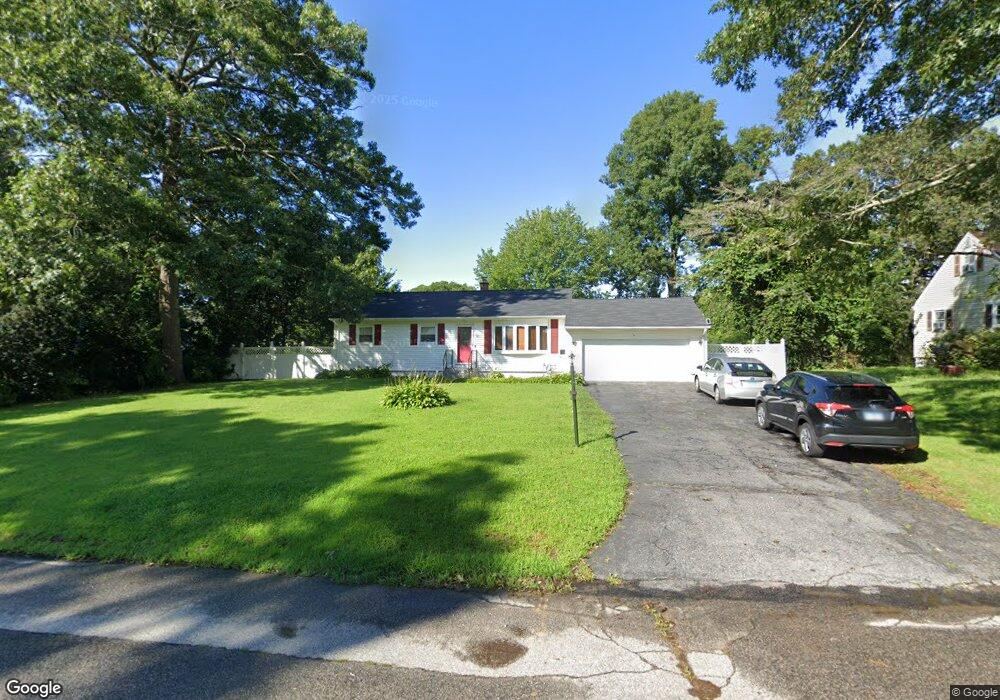
30 Vermont Dr Oakdale, CT 06370
Estimated Value: $342,000 - $358,047
3
Beds
3
Baths
1,000
Sq Ft
$349/Sq Ft
Est. Value
About This Home
This home is located at 30 Vermont Dr, Oakdale, CT 06370 and is currently estimated at $348,512, approximately $348 per square foot. 30 Vermont Dr is a home located in New London County with nearby schools including Leonard J. Tyl Middle School and Montville High School.
Ownership History
Date
Name
Owned For
Owner Type
Purchase Details
Closed on
Jul 15, 2008
Sold by
Chfa
Bought by
Dave Bhasker J and Dave Pallivika B
Current Estimated Value
Home Financials for this Owner
Home Financials are based on the most recent Mortgage that was taken out on this home.
Original Mortgage
$198,300
Outstanding Balance
$127,768
Interest Rate
6.13%
Estimated Equity
$220,744
Purchase Details
Closed on
Sep 23, 2005
Sold by
Copeland Karen and Copeland James
Bought by
Alvis Edgar and Alvis Luce Lenia
Purchase Details
Closed on
Oct 6, 2003
Sold by
Bellinger Kenneth and Bllinger Rita
Bought by
Copeland James and Copeland Karen
Purchase Details
Closed on
Mar 30, 2001
Sold by
Oconnor Barbara
Bought by
Bellinger Kenneth
Purchase Details
Closed on
Jul 31, 1995
Sold by
Tucker Michael J and Tucker Robinette
Bought by
Hagerman Paul B and Hagerman Pamela
Create a Home Valuation Report for This Property
The Home Valuation Report is an in-depth analysis detailing your home's value as well as a comparison with similar homes in the area
Home Values in the Area
Average Home Value in this Area
Purchase History
| Date | Buyer | Sale Price | Title Company |
|---|---|---|---|
| Dave Bhasker J | $199,900 | -- | |
| Dave Bhasker J | $199,900 | -- | |
| Alvis Edgar | $239,900 | -- | |
| Alvis Edgar | $239,900 | -- | |
| Copeland James | $186,000 | -- | |
| Copeland James | $186,000 | -- | |
| Bellinger Kenneth | $125,000 | -- | |
| Bellinger Kenneth | $125,000 | -- | |
| Hagerman Paul B | $105,000 | -- | |
| Hagerman Paul B | $105,000 | -- |
Source: Public Records
Mortgage History
| Date | Status | Borrower | Loan Amount |
|---|---|---|---|
| Open | Hagerman Paul B | $198,300 | |
| Closed | Hagerman Paul B | $3,500 |
Source: Public Records
Tax History Compared to Growth
Tax History
| Year | Tax Paid | Tax Assessment Tax Assessment Total Assessment is a certain percentage of the fair market value that is determined by local assessors to be the total taxable value of land and additions on the property. | Land | Improvement |
|---|---|---|---|---|
| 2025 | $4,094 | $141,820 | $31,220 | $110,600 |
| 2024 | $3,938 | $141,820 | $31,220 | $110,600 |
| 2023 | $3,938 | $141,820 | $31,220 | $110,600 |
| 2022 | $3,788 | $141,820 | $31,220 | $110,600 |
| 2021 | $3,672 | $115,650 | $32,340 | $83,310 |
| 2020 | $3,745 | $115,650 | $32,340 | $83,310 |
| 2019 | $3,760 | $115,650 | $32,340 | $83,310 |
| 2018 | $3,670 | $115,650 | $32,350 | $83,300 |
| 2017 | $3,666 | $115,650 | $32,350 | $83,300 |
| 2016 | $3,591 | $117,310 | $41,570 | $75,740 |
| 2015 | $3,591 | $117,310 | $41,570 | $75,740 |
| 2014 | $3,445 | $117,310 | $41,570 | $75,740 |
Source: Public Records
Map
Nearby Homes
- 1300 Old Colchester Rd
- 17 Manor Rd
- 15 Forsyth Rd
- 94 Massachusetts Rd
- 485 Chapel Hill Rd
- 385 Oxoboxo Dam Rd
- 33D Laurel Point Dr
- 33A Laurel Point Dr
- 211 Forsyth Rd
- 53 Lake Dr
- 8 Eddy Ct
- 1578 Old Colchester Rd
- 1399 Route 163
- 56 Evergreen Ln
- 636 Connecticut 163
- 36 Beechwood Rd
- 12 Church Rd
- 52 Lake View Ave
- 79 Cottonwood Ln
- 89 Harris Road Extension