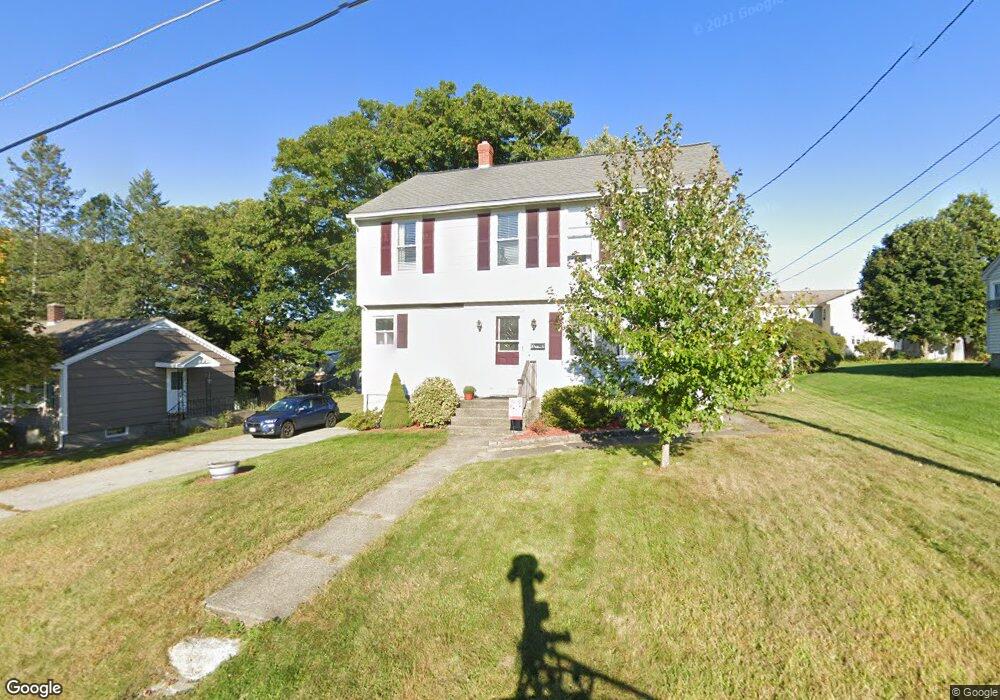
30 Wellman St Auburn, MA 01501
Stoneville NeighborhoodEstimated Value: $390,000 - $459,000
2
Beds
1
Bath
800
Sq Ft
$540/Sq Ft
Est. Value
About This Home
This home is located at 30 Wellman St, Auburn, MA 01501 and is currently estimated at $431,762, approximately $539 per square foot. 30 Wellman St is a home located in Worcester County with nearby schools including Auburn Senior High School, Canterbury Street School, and Shrewsbury Montessori School - Auburn Campus.
Ownership History
Date
Name
Owned For
Owner Type
Purchase Details
Closed on
Sep 29, 2004
Sold by
Hines James T
Bought by
Hines James T and Hines Julia T
Current Estimated Value
Home Financials for this Owner
Home Financials are based on the most recent Mortgage that was taken out on this home.
Original Mortgage
$144,000
Outstanding Balance
$71,507
Interest Rate
5.81%
Mortgage Type
Purchase Money Mortgage
Estimated Equity
$360,255
Purchase Details
Closed on
Dec 24, 1997
Sold by
Gordon Mark J
Bought by
Hines James T
Home Financials for this Owner
Home Financials are based on the most recent Mortgage that was taken out on this home.
Original Mortgage
$79,008
Interest Rate
7.15%
Mortgage Type
Purchase Money Mortgage
Create a Home Valuation Report for This Property
The Home Valuation Report is an in-depth analysis detailing your home's value as well as a comparison with similar homes in the area
Home Values in the Area
Average Home Value in this Area
Purchase History
| Date | Buyer | Sale Price | Title Company |
|---|---|---|---|
| Hines James T | -- | -- | |
| Hines James T | $80,000 | -- |
Source: Public Records
Mortgage History
| Date | Status | Borrower | Loan Amount |
|---|---|---|---|
| Open | Hines James T | $144,000 | |
| Previous Owner | Hines James T | $125,000 | |
| Previous Owner | Hines James T | $79,008 |
Source: Public Records
Tax History Compared to Growth
Tax History
| Year | Tax Paid | Tax Assessment Tax Assessment Total Assessment is a certain percentage of the fair market value that is determined by local assessors to be the total taxable value of land and additions on the property. | Land | Improvement |
|---|---|---|---|---|
| 2025 | $51 | $358,900 | $113,300 | $245,600 |
| 2024 | $5,252 | $351,800 | $107,500 | $244,300 |
| 2023 | $5,010 | $315,500 | $97,700 | $217,800 |
| 2022 | $4,666 | $277,400 | $97,700 | $179,700 |
| 2021 | $4,412 | $243,200 | $86,200 | $157,000 |
| 2020 | $4,373 | $243,200 | $86,200 | $157,000 |
| 2019 | $4,231 | $229,700 | $85,300 | $144,400 |
| 2018 | $0 | $218,500 | $79,800 | $138,700 |
| 2017 | $3,870 | $211,000 | $72,300 | $138,700 |
| 2016 | $3,665 | $202,600 | $75,700 | $126,900 |
| 2015 | $3,352 | $194,200 | $75,700 | $118,500 |
| 2014 | $3,282 | $189,800 | $72,100 | $117,700 |
Source: Public Records
Map
Nearby Homes
- 8 Shirley St
- 5 Commonwealth Ave
- 176 Boyce St
- 177 Boyce St
- 4 S Edlin St
- 25 Vinal St Unit 26
- 25 Vinal St Unit 29
- 25 Vinal St Unit 30
- 20 Alpine Trail
- 2 Keen St
- 177 Oxford St N
- 34 Rockland Rd
- 53 James St
- 35 Genessee St Unit I
- 27 Havana Rd
- 19-20 Williams St
- 37 Elmwood St
- 170 Stafford St
- 61 Elmwood St
- 114 Henshaw St