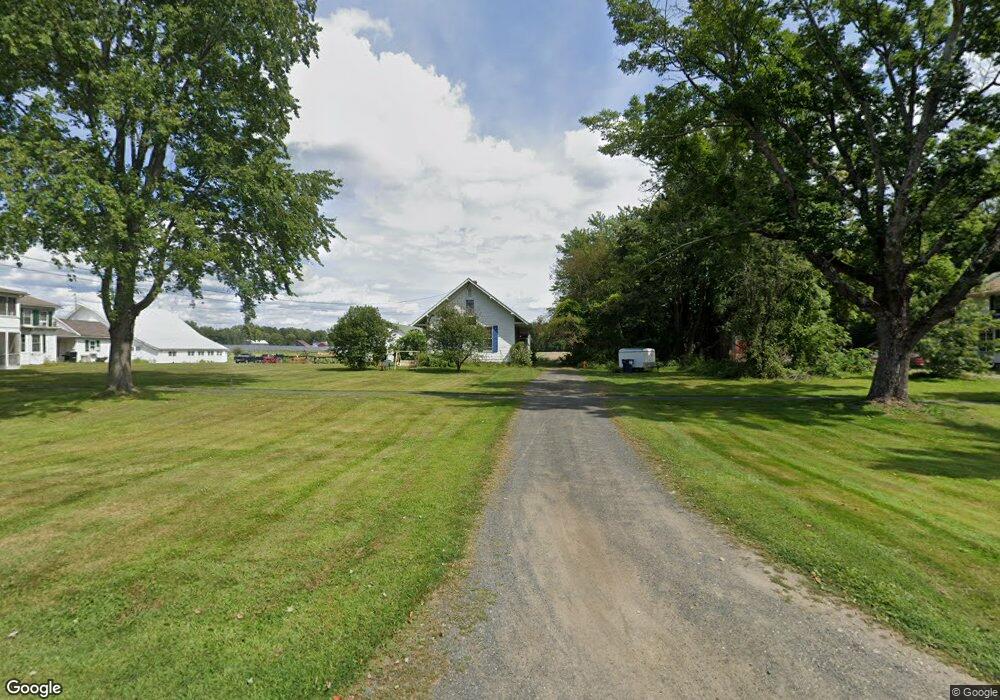
30 West St Hadley, MA 01035
Estimated Value: $315,001 - $491,000
3
Beds
1
Bath
1,593
Sq Ft
$270/Sq Ft
Est. Value
About This Home
This home is located at 30 West St, Hadley, MA 01035 and is currently estimated at $429,750, approximately $269 per square foot. 30 West St is a home located in Hampshire County with nearby schools including Hadley Elementary School, Hopkins Academy, and Pioneer Valley Chinese Immersion Charter School.
Ownership History
Date
Name
Owned For
Owner Type
Purchase Details
Closed on
Aug 19, 2011
Sold by
Bowler Thomas
Bought by
Bowler Norah E and Bowler Catherine
Current Estimated Value
Home Financials for this Owner
Home Financials are based on the most recent Mortgage that was taken out on this home.
Original Mortgage
$47,000
Outstanding Balance
$32,618
Interest Rate
4.62%
Mortgage Type
Purchase Money Mortgage
Estimated Equity
$397,132
Create a Home Valuation Report for This Property
The Home Valuation Report is an in-depth analysis detailing your home's value as well as a comparison with similar homes in the area
Home Values in the Area
Average Home Value in this Area
Purchase History
| Date | Buyer | Sale Price | Title Company |
|---|---|---|---|
| Bowler Norah E | $30,000 | -- |
Source: Public Records
Mortgage History
| Date | Status | Borrower | Loan Amount |
|---|---|---|---|
| Open | Bowler Norah E | $47,000 |
Source: Public Records
Tax History
| Year | Tax Paid | Tax Assessment Tax Assessment Total Assessment is a certain percentage of the fair market value that is determined by local assessors to be the total taxable value of land and additions on the property. | Land | Improvement |
|---|---|---|---|---|
| 2025 | $2,960 | $254,500 | $84,000 | $170,500 |
| 2024 | $2,867 | $251,700 | $84,000 | $167,700 |
| 2023 | $2,727 | $236,300 | $84,000 | $152,300 |
| 2022 | $2,395 | $196,600 | $84,000 | $112,600 |
| 2021 | $2,308 | $192,300 | $84,000 | $108,300 |
| 2020 | $2,359 | $184,600 | $84,000 | $100,600 |
| 2019 | $2,282 | $184,600 | $84,000 | $100,600 |
| 2018 | $2,139 | $176,900 | $84,000 | $92,900 |
| 2017 | $2,179 | $188,300 | $84,000 | $104,300 |
| 2016 | $2,100 | $188,300 | $84,000 | $104,300 |
| 2015 | $2,045 | $188,300 | $84,000 | $104,300 |
| 2014 | $2,004 | $188,300 | $84,000 | $104,300 |
Source: Public Records
Map
Nearby Homes
- 11 West St
- 0 N Branch Rd
- 133 Middle St
- 26 Russell St Unit A-B
- 83 Bay Rd
- 109 Bay Rd
- 35 Hubbard Ave
- 18 Elm St
- 58 Main St Unit 4
- 58 Main St Unit 3
- 22 Woodbine Ave
- 80 Damon Rd Unit 8201
- 80 Damon Rd Unit 5104
- 80 Damon Rd Unit 4302
- 20 View Ave Unit A
- 30 View Ave
- 62 Bridge St
- 50 Union St Unit 18
- 51 Phillips Place Unit 1
- 10 Hawley St Unit 4C
Your Personal Tour Guide
Ask me questions while you tour the home.