Estimated Value: $139,639 - $206,000
Studio
--
Bath
--
Sq Ft
6,534
Sq Ft Lot
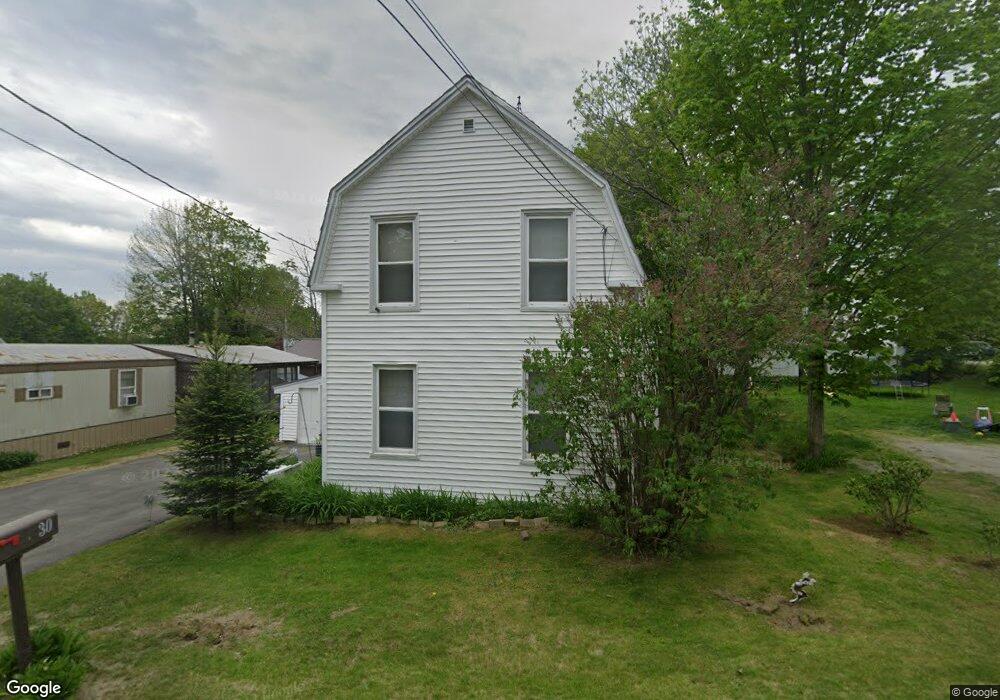
About This Home
This home is located at 30 Wilson St, Anson, ME 04911 and is currently estimated at $168,660. 30 Wilson St is a home.
Ownership History
Date
Name
Owned For
Owner Type
Purchase Details
Closed on
Jul 3, 2008
Sold by
Withee Ronald E
Bought by
Withee Ronald E and Withee Rosalyn
Current Estimated Value
Home Financials for this Owner
Home Financials are based on the most recent Mortgage that was taken out on this home.
Original Mortgage
$64,000
Interest Rate
6.01%
Mortgage Type
Commercial
Purchase Details
Closed on
Oct 3, 2005
Sold by
Walker Martha A
Bought by
Withee Ronald E
Home Financials for this Owner
Home Financials are based on the most recent Mortgage that was taken out on this home.
Original Mortgage
$45,000
Interest Rate
5.84%
Mortgage Type
Commercial
Create a Home Valuation Report for This Property
The Home Valuation Report is an in-depth analysis detailing your home's value as well as a comparison with similar homes in the area
Home Values in the Area
Average Home Value in this Area
Purchase History
| Date | Buyer | Sale Price | Title Company |
|---|---|---|---|
| Withee Ronald E | -- | -- | |
| Withee Ronald E | -- | -- |
Source: Public Records
Mortgage History
| Date | Status | Borrower | Loan Amount |
|---|---|---|---|
| Closed | Withee Ronald E | $64,000 | |
| Closed | Withee Ronald E | $45,000 |
Source: Public Records
Tax History
| Year | Tax Paid | Tax Assessment Tax Assessment Total Assessment is a certain percentage of the fair market value that is determined by local assessors to be the total taxable value of land and additions on the property. | Land | Improvement |
|---|---|---|---|---|
| 2025 | $1,899 | $102,760 | $11,850 | $90,910 |
| 2024 | $1,685 | $102,760 | $11,850 | $90,910 |
| 2023 | $1,468 | $77,260 | $8,910 | $68,350 |
| 2022 | $1,391 | $77,260 | $8,910 | $68,350 |
| 2021 | $1,394 | $67,180 | $7,750 | $59,430 |
| 2020 | $1,495 | $67,180 | $7,750 | $59,430 |
| 2019 | $1,478 | $67,180 | $7,750 | $59,430 |
| 2018 | $1,409 | $67,180 | $7,750 | $59,430 |
| 2017 | $1,344 | $67,180 | $7,750 | $59,430 |
| 2016 | $1,270 | $67,180 | $7,750 | $59,430 |
| 2015 | $1,344 | $67,180 | $7,750 | $59,430 |
| 2014 | $1,344 | $67,180 | $7,750 | $59,430 |
| 2013 | $1,317 | $67,180 | $7,750 | $59,430 |
Source: Public Records
Map
Nearby Homes
Your Personal Tour Guide
Ask me questions while you tour the home.