300 2nd Ave N Unit 1F Edmonds, WA 98020
Edmonds Bowl NeighborhoodEstimated Value: $602,023 - $676,000
2
Beds
1
Bath
946
Sq Ft
$682/Sq Ft
Est. Value
About This Home
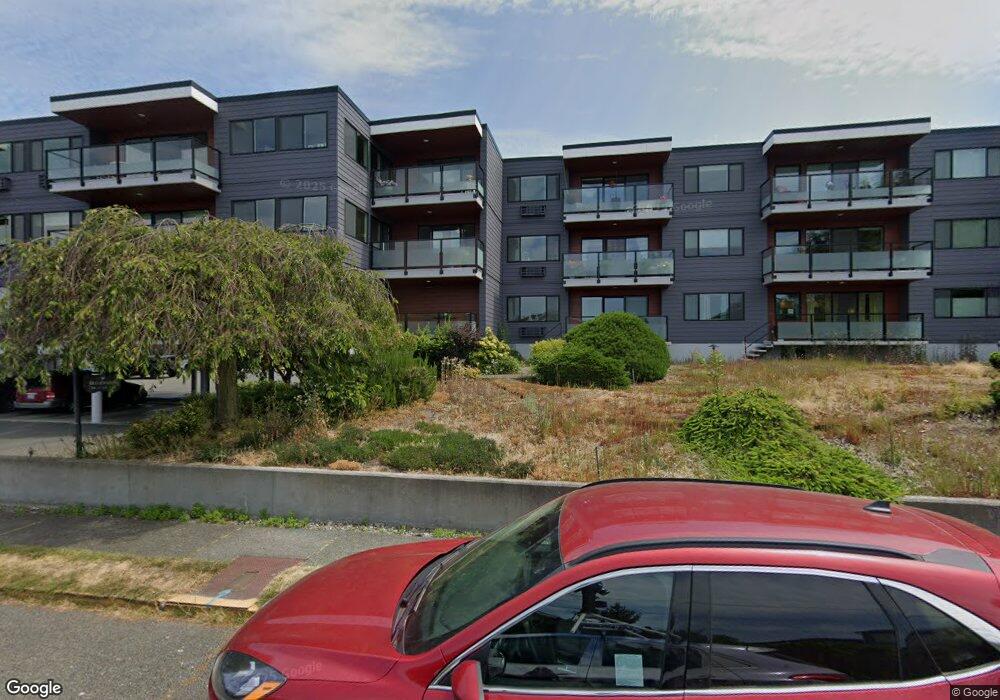
This home is located at 300 2nd Ave N Unit 1F, Edmonds, WA 98020 and is currently estimated at $645,256, approximately $682 per square foot. 300 2nd Ave N Unit 1F is a home located in Snohomish County with nearby schools including Edmonds Elementary School, College Place Middle School, and Edmonds-Woodway High School.
Ownership History
Date
Name
Owned For
Owner Type
Purchase Details
Closed on
Mar 28, 2023
Sold by
Murphy James H
Bought by
Murphy James H and Murphy Katherine E
Current Estimated Value
Purchase Details
Closed on
Oct 11, 2012
Sold by
Murphy James H
Bought by
Murphy Katherine E and Murphy James H
Purchase Details
Closed on
Jun 22, 2009
Sold by
Tolford Edward A and Tolford Loreen N
Bought by
Murphy James H
Home Financials for this Owner
Home Financials are based on the most recent Mortgage that was taken out on this home.
Original Mortgage
$99,200
Interest Rate
4.83%
Mortgage Type
Purchase Money Mortgage
Purchase Details
Closed on
Jul 28, 2005
Sold by
Schmidt Katryn K
Bought by
Murphy James H
Purchase Details
Closed on
Jul 26, 2004
Sold by
Thomas Rita R
Bought by
Schmidt Katryn K
Home Financials for this Owner
Home Financials are based on the most recent Mortgage that was taken out on this home.
Original Mortgage
$174,400
Interest Rate
6.27%
Mortgage Type
Balloon
Purchase Details
Closed on
Oct 21, 1998
Sold by
Drake Louise and Drake Florence Louise
Bought by
Taylor Ruth A
Create a Home Valuation Report for This Property
The Home Valuation Report is an in-depth analysis detailing your home's value as well as a comparison with similar homes in the area
Home Values in the Area
Average Home Value in this Area
Purchase History
| Date | Buyer | Sale Price | Title Company |
|---|---|---|---|
| Murphy James H | -- | -- | |
| Murphy Katherine E | -- | None Available | |
| Murphy James H | $349,200 | Pnwt | |
| Murphy James H | $249,290 | Pnwt | |
| Schmidt Katryn K | $218,000 | First American | |
| Taylor Ruth A | $182,500 | Pacific Northwest Title |
Source: Public Records
Mortgage History
| Date | Status | Borrower | Loan Amount |
|---|---|---|---|
| Previous Owner | Murphy James H | $99,200 | |
| Previous Owner | Schmidt Katryn K | $174,400 |
Source: Public Records
Tax History Compared to Growth
Tax History
| Year | Tax Paid | Tax Assessment Tax Assessment Total Assessment is a certain percentage of the fair market value that is determined by local assessors to be the total taxable value of land and additions on the property. | Land | Improvement |
|---|---|---|---|---|
| 2025 | $3,424 | $462,000 | $275,000 | $187,000 |
| 2024 | $3,424 | $481,200 | $275,000 | $206,200 |
| 2023 | $3,321 | $483,700 | $275,000 | $208,700 |
| 2022 | $3,513 | $420,600 | $250,000 | $170,600 |
| 2020 | $3,765 | $403,200 | $250,000 | $153,200 |
| 2019 | $3,534 | $381,200 | $250,000 | $131,200 |
| 2018 | $4,030 | $375,600 | $250,000 | $125,600 |
| 2017 | $2,697 | $263,000 | $90,500 | $172,500 |
| 2016 | $2,453 | $237,000 | $72,500 | $164,500 |
| 2015 | $2,369 | $215,500 | $67,000 | $148,500 |
| 2013 | $2,285 | $196,000 | $74,500 | $121,500 |
Source: Public Records
Map
Nearby Homes
- 621 Daley St
- 611 3rd Ave N
- 603 7th Ave N Unit A306
- 625 Aloha Way
- 609 7th Ave N Unit B204
- 233 3rd Ave S Unit 304
- 302 6th Ave S
- 335 3rd Ave S Unit 203
- 404 3rd Ave S Unit A201
- 816 Walnut St
- 960 5th Ave S Unit 208
- 1414 9th Ave N Unit 105
- 1514 9th Ave N
- 1030 Grandview St
- 1021 Walnut St
- 1071 4th Ave S Unit 302
- 55 Pine St Unit 203
- 71 Pine St Unit 212
- 71 Pine St Unit 302
- 1110 5th Ave S Unit 204
- 300 2nd Ave N Unit 3H
- 300 2nd Ave N Unit 3G
- 300 2nd Ave N Unit 3F
- 300 2nd Ave N Unit 3E
- 300 2nd Ave N Unit 3D
- 300 2nd Ave N Unit 3C
- 300 2nd Ave N Unit 3B
- 300 2nd Ave N Unit 3A
- 300 2nd Ave N Unit 2H
- 300 2nd Ave N Unit 2G
- 300 2nd Ave N Unit 2F
- 300 2nd Ave N Unit 2E
- 300 2nd Ave N Unit 2D
- 300 2nd Ave N Unit 2C
- 300 2nd Ave N Unit 2B
- 300 2nd Ave N Unit 2A
- 300 2nd Ave N Unit 1H
- 300 2nd Ave N Unit 1G
- 300 2nd Ave N Unit 1E
- 300 2nd Ave N Unit 1B