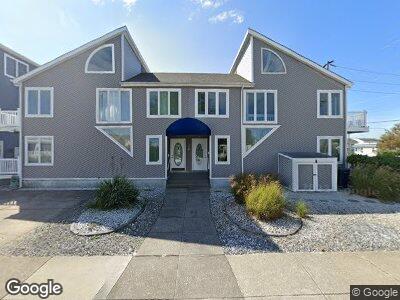
300 37th St S Unit B Brigantine, NJ 08203
Estimated Value: $595,000 - $649,000
--
Bed
--
Bath
1,086
Sq Ft
$577/Sq Ft
Est. Value
About This Home
This home is located at 300 37th St S Unit B, Brigantine, NJ 08203 and is currently estimated at $626,315, approximately $576 per square foot. 300 37th St S Unit B is a home located in Atlantic County with nearby schools including Brigantine Elementary School, Brigantine Community School, and New Hope Christian Academy/Robinson Small Learning Center.
Ownership History
Date
Name
Owned For
Owner Type
Purchase Details
Closed on
Apr 13, 2001
Sold by
Love Robyn M
Bought by
Vanaman Elwood B and Vanaman Evelyn G
Current Estimated Value
Home Financials for this Owner
Home Financials are based on the most recent Mortgage that was taken out on this home.
Original Mortgage
$150,000
Interest Rate
6.97%
Purchase Details
Closed on
Jun 10, 1998
Sold by
Matregrano Louis J
Bought by
Love Robyn M
Home Financials for this Owner
Home Financials are based on the most recent Mortgage that was taken out on this home.
Original Mortgage
$126,000
Interest Rate
7.11%
Mortgage Type
Balloon
Purchase Details
Closed on
Mar 4, 1991
Sold by
Matregrano Louis J and Matregrano Simie N
Bought by
Matregrano Louis J
Purchase Details
Closed on
Aug 29, 1988
Sold by
Stanfa Charles and Stanfa Deborah
Bought by
Matregrano Louis J and Matregrano Simie N
Create a Home Valuation Report for This Property
The Home Valuation Report is an in-depth analysis detailing your home's value as well as a comparison with similar homes in the area
Home Values in the Area
Average Home Value in this Area
Purchase History
| Date | Buyer | Sale Price | Title Company |
|---|---|---|---|
| Vanaman Elwood B | $195,000 | -- | |
| Love Robyn M | $140,000 | Commonwealth Land Title Ins | |
| Matregrano Louis J | -- | -- | |
| Matregrano Louis J | $190,000 | -- |
Source: Public Records
Mortgage History
| Date | Status | Borrower | Loan Amount |
|---|---|---|---|
| Closed | Vanaman Elwood | $147,550 | |
| Closed | Vanaman Elwood B | $153,550 | |
| Closed | Vanaman Elwood B | $150,000 | |
| Previous Owner | Love Robyn M | $126,000 |
Source: Public Records
Tax History Compared to Growth
Tax History
| Year | Tax Paid | Tax Assessment Tax Assessment Total Assessment is a certain percentage of the fair market value that is determined by local assessors to be the total taxable value of land and additions on the property. | Land | Improvement |
|---|---|---|---|---|
| 2024 | $5,610 | $298,400 | $182,000 | $116,400 |
| 2023 | $5,183 | $298,400 | $182,000 | $116,400 |
| 2022 | $5,183 | $298,400 | $182,000 | $116,400 |
| 2021 | $5,091 | $298,400 | $182,000 | $116,400 |
| 2020 | $5,037 | $298,400 | $182,000 | $116,400 |
| 2019 | $5,082 | $298,400 | $182,000 | $116,400 |
| 2018 | $5,183 | $298,400 | $182,000 | $116,400 |
| 2017 | $5,267 | $298,400 | $182,000 | $116,400 |
| 2016 | $5,264 | $298,400 | $182,000 | $116,400 |
| 2015 | $5,291 | $298,400 | $182,000 | $116,400 |
| 2014 | $5,094 | $298,400 | $182,000 | $116,400 |
Source: Public Records
Map
Nearby Homes
- 326 S 37 St Unit A (1st Floor, right
- 327 36th St S Unit B
- 327 36th St S Unit A
- 3801 Ocean Ave Unit 4
- 3700 Ocean Ave Unit A
- 279 39th St S Unit upstairs
- 279 39th St S Unit A
- 269 39th St S Unit A
- 269 39th St S
- 3500 Ocean Ave Unit 6
- 246 37th St S
- 251 38th St S
- 326 40th St S
- 3401 Ocean Ave Unit 9
- 289 40th St S Unit B
- 4111 W Brigantine Ave
- 249 40th St S Unit B
- 222 39th St S Unit A
- 210 34th St S
- 231 33rd St S Unit A
- 300 37th St S Unit A
- 300 37th St S Unit B
- 3706 W Brigantine Ave
- 310 37th St S
- 301 37th St S
- 314 37th St S
- 3712 W Brigantine Ave Unit A
- 3712 W Brigantine Ave
- 3712 W Brigantine Ave Unit B
- 3712 W Brigantine Ave
- 3712 W Brigantine Ave
- 3712 Brigantine Unit C Ave
- 3712 W Brigantine Ave Unit B
- 311 37th St S
- 311 38th St S
- 3612 W Brigantine Ave
- 318 37th St S
- 315 37th St S
- 315 37th St S Unit A
- 315 37th St S Unit B