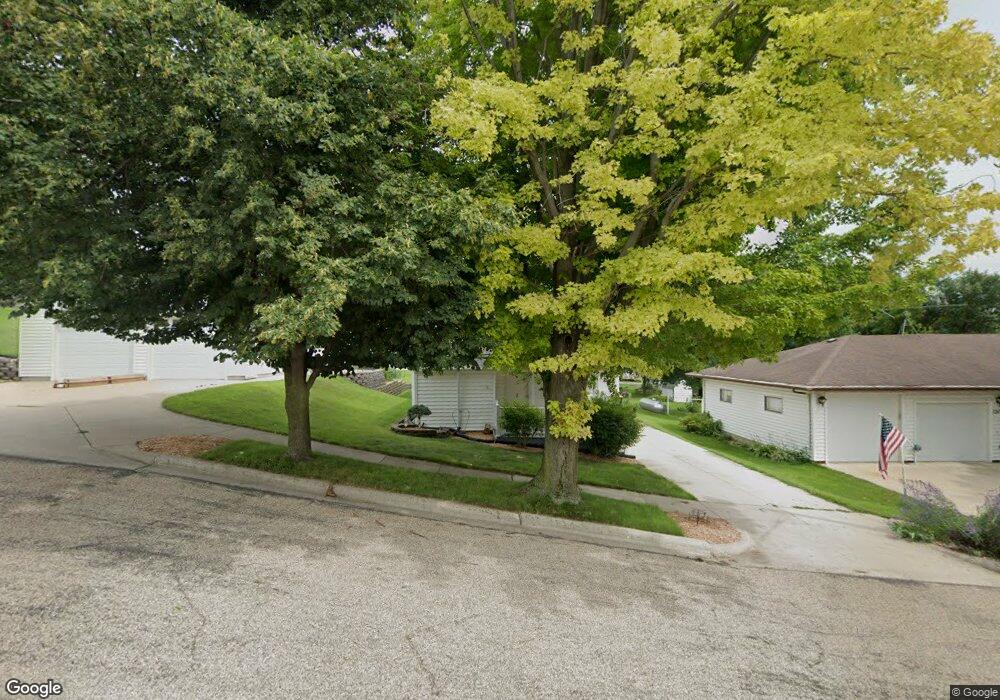
300 4th St Chandler, MN 56122
Estimated Value: $76,260 - $152,000
--
Bed
--
Bath
1,084
Sq Ft
$105/Sq Ft
Est. Value
About This Home
This home is located at 300 4th St, Chandler, MN 56122 and is currently estimated at $113,565, approximately $104 per square foot. 300 4th St is a home located in Murray County with nearby schools including West Elementary School, Murray County Central High School, and Chandler Christian School.
Ownership History
Date
Name
Owned For
Owner Type
Purchase Details
Closed on
Sep 15, 2020
Sold by
Dominguez Jose Jose
Bought by
Rodas Aguirre Jose Jose
Current Estimated Value
Home Financials for this Owner
Home Financials are based on the most recent Mortgage that was taken out on this home.
Original Mortgage
$32,000
Outstanding Balance
$28,377
Interest Rate
2.86%
Estimated Equity
$85,188
Purchase Details
Closed on
Sep 18, 2015
Bought by
Dominguez Jose Israel
Create a Home Valuation Report for This Property
The Home Valuation Report is an in-depth analysis detailing your home's value as well as a comparison with similar homes in the area
Home Values in the Area
Average Home Value in this Area
Purchase History
| Date | Buyer | Sale Price | Title Company |
|---|---|---|---|
| Rodas Aguirre Jose Jose | $47,000 | -- | |
| Dominguez Jose Israel | $35,000 | -- | |
| Dominguez Jose | $35,000 | -- |
Source: Public Records
Mortgage History
| Date | Status | Borrower | Loan Amount |
|---|---|---|---|
| Open | Rodas Aguirre Jose Jose | $32,000 | |
| Closed | Rodas Aguirre Jose Jose | -- |
Source: Public Records
Tax History Compared to Growth
Tax History
| Year | Tax Paid | Tax Assessment Tax Assessment Total Assessment is a certain percentage of the fair market value that is determined by local assessors to be the total taxable value of land and additions on the property. | Land | Improvement |
|---|---|---|---|---|
| 2025 | $760 | $65,100 | $3,700 | $61,400 |
| 2024 | $730 | $66,500 | $3,700 | $62,800 |
| 2023 | $666 | $65,000 | $3,700 | $61,300 |
| 2022 | $628 | $51,700 | $3,400 | $48,300 |
| 2021 | $548 | $43,200 | $2,800 | $40,400 |
| 2020 | $522 | $36,100 | $2,800 | $33,300 |
| 2019 | $518 | $33,400 | $2,800 | $30,600 |
| 2018 | $514 | $33,600 | $2,800 | $30,800 |
| 2017 | $496 | $33,600 | $2,800 | $30,800 |
| 2016 | $472 | $0 | $0 | $0 |
| 2015 | -- | $0 | $0 | $0 |
| 2014 | -- | $0 | $0 | $0 |
Source: Public Records
Map
Nearby Homes