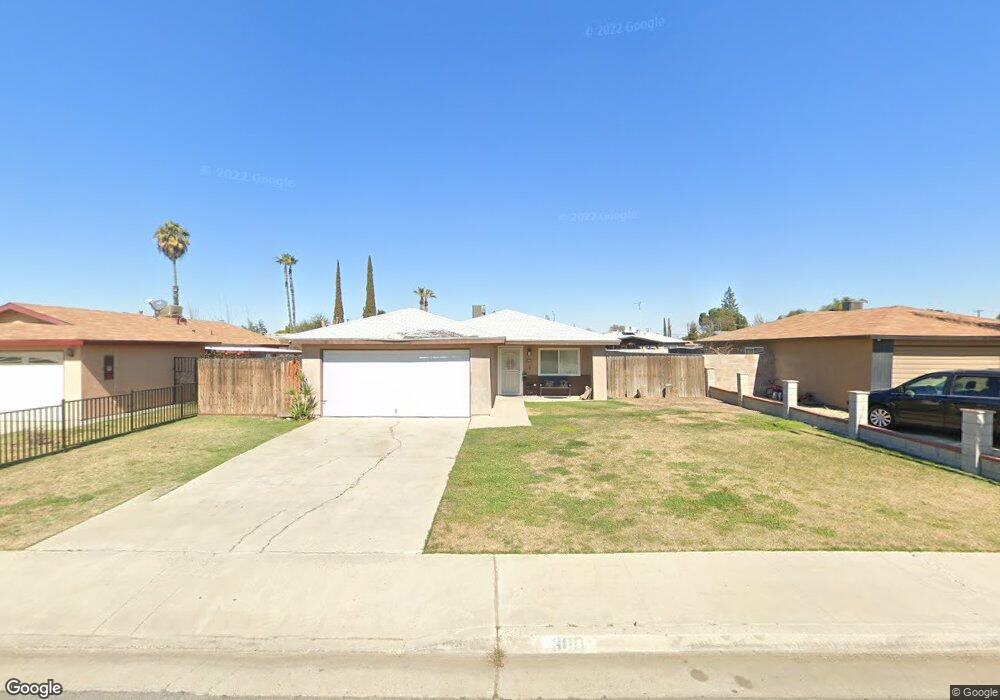
300 Atkinson Ave Shafter, CA 93263
Estimated Value: $227,000 - $379,000
3
Beds
2
Baths
1,040
Sq Ft
$271/Sq Ft
Est. Value
About This Home
This home is located at 300 Atkinson Ave, Shafter, CA 93263 and is currently estimated at $282,269, approximately $271 per square foot. 300 Atkinson Ave is a home located in Kern County with nearby schools including Golden Oak Elementary School, Shafter High School, and Grow Academy Shafter.
Ownership History
Date
Name
Owned For
Owner Type
Purchase Details
Closed on
Jul 21, 2021
Sold by
Sublett Cynthia and Argueta Cynthia
Bought by
Sublett Cynthia
Current Estimated Value
Home Financials for this Owner
Home Financials are based on the most recent Mortgage that was taken out on this home.
Original Mortgage
$185,100
Outstanding Balance
$154,926
Interest Rate
2.93%
Estimated Equity
$127,343
Purchase Details
Closed on
Nov 3, 2003
Sold by
Argueta Gregorio
Bought by
Argueta Cynthia
Purchase Details
Closed on
Sep 12, 1997
Sold by
Sublett Tommy R and Sublett Dolores J
Bought by
Yanez Cynthia
Home Financials for this Owner
Home Financials are based on the most recent Mortgage that was taken out on this home.
Original Mortgage
$65,235
Interest Rate
7.49%
Mortgage Type
FHA
Purchase Details
Closed on
Dec 1, 1995
Sold by
Sublett Dolores J
Bought by
Sublett Tommy R
Create a Home Valuation Report for This Property
The Home Valuation Report is an in-depth analysis detailing your home's value as well as a comparison with similar homes in the area
Home Values in the Area
Average Home Value in this Area
Purchase History
| Date | Buyer | Sale Price | Title Company |
|---|---|---|---|
| Sublett Cynthia | -- | Title365 | |
| Argueta Cynthia | -- | -- | |
| Yanez Cynthia | $65,000 | Fidelity National Title Co | |
| Sublett Tommy R | -- | Commonwealth Land Title Co |
Source: Public Records
Mortgage History
| Date | Status | Borrower | Loan Amount |
|---|---|---|---|
| Open | Sublett Cynthia | $185,100 | |
| Closed | Yanez Cynthia | $65,235 |
Source: Public Records
Tax History
| Year | Tax Paid | Tax Assessment Tax Assessment Total Assessment is a certain percentage of the fair market value that is determined by local assessors to be the total taxable value of land and additions on the property. | Land | Improvement |
|---|---|---|---|---|
| 2025 | $1,387 | $103,753 | $31,921 | $71,832 |
| 2024 | $1,341 | $101,720 | $31,296 | $70,424 |
| 2023 | $1,341 | $99,727 | $30,683 | $69,044 |
| 2022 | $1,280 | $97,773 | $30,082 | $67,691 |
| 2021 | $1,217 | $95,857 | $29,493 | $66,364 |
| 2020 | $1,217 | $94,875 | $29,191 | $65,684 |
| 2019 | $1,171 | $94,875 | $29,191 | $65,684 |
| 2018 | $1,127 | $91,193 | $28,058 | $63,135 |
| 2017 | $1,119 | $89,406 | $27,508 | $61,898 |
| 2016 | $1,056 | $87,654 | $26,969 | $60,685 |
| 2015 | $1,025 | $86,338 | $26,564 | $59,774 |
| 2014 | $985 | $84,648 | $26,044 | $58,604 |
Source: Public Records
Map
Nearby Homes
- 9211 Woodbrook Dr
- 137 W Ash Ave
- 355 S Wall St
- 849 Brittany St
- 700 S Shafter Ave Unit 115
- 408 W Euclid Ave
- 135 E Orange Ave
- 187 E Orange Ave
- 245 Atlantic Ave
- 285 E Ash Ave
- 111 Planada Dr
- 249 E Marengo Ave
- 3714 Bird Ct
- 8413 Bareback Ave
- 208 California Ave
- 611 Ohanneson Ave
- 0 Beech Ave Unit IG25056068
- 0 Lerdo Hwy Unit 202600415
- 0 Lerdo Hwy Unit 202506871
- 0 Beech Ave Unit 202305944
- 306 Atkinson Ave
- 274 Atkinson Ave
- 268 Atkinson Ave
- 314 Atkinson Ave
- 301 Rodriguez Ave
- 307 Rodriguez Ave
- 275 Rodriguez Ave
- 320 Atkinson Ave
- 262 Atkinson Ave
- 301 Atkinson Ave
- 269 Rodriguez Ave
- 315 Rodriguez Ave
- 275 Atkinson Ave
- 307 Atkinson Ave
- 269 Atkinson Ave
- 315 Atkinson Ave
- 321 Rodriguez Ave
- 263 Rodriguez Ave
- 256 Atkinson Ave
- 326 Atkinson Ave
Your Personal Tour Guide
Ask me questions while you tour the home.