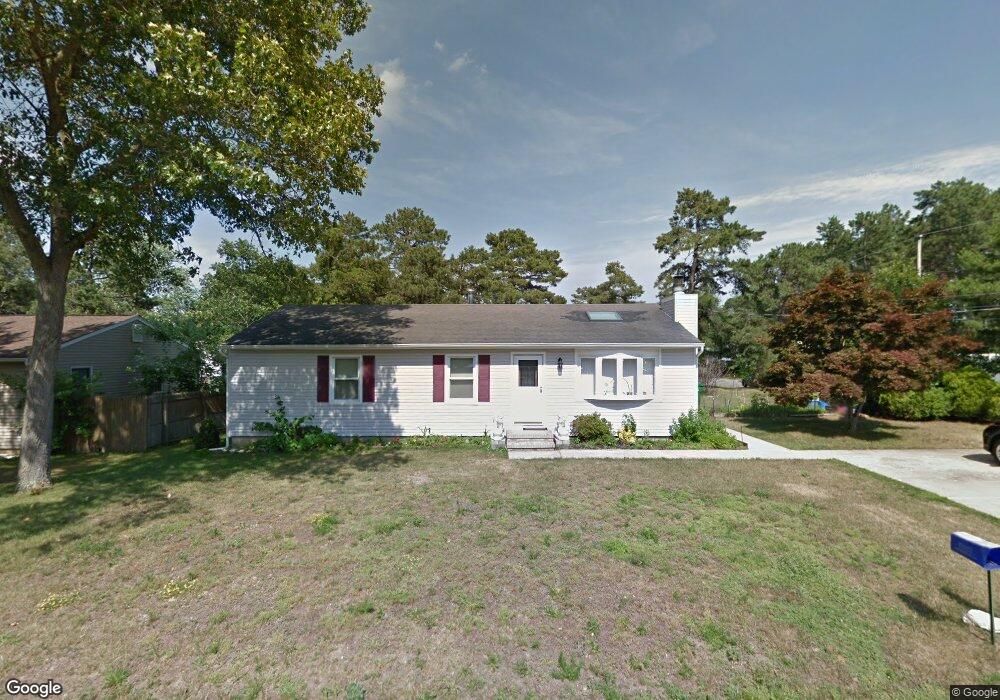
300 Beechmont St Toms River, NJ 08757
Manchester Township NeighborhoodEstimated Value: $405,285
3
Beds
1
Bath
1,296
Sq Ft
$313/Sq Ft
Est. Value
About This Home
This home is located at 300 Beechmont St, Toms River, NJ 08757 and is currently estimated at $405,285, approximately $312 per square foot. 300 Beechmont St is a home located in Ocean County with nearby schools including Manchester Township High School and Ocean County Christian Academy.
Ownership History
Date
Name
Owned For
Owner Type
Purchase Details
Closed on
Apr 26, 2002
Current Estimated Value
Purchase Details
Closed on
Oct 31, 2001
Sold by
Stein Joseph
Bought by
Coates Edward
Home Financials for this Owner
Home Financials are based on the most recent Mortgage that was taken out on this home.
Original Mortgage
$114,300
Interest Rate
6.77%
Purchase Details
Closed on
Jul 1, 1996
Sold by
Amboy National Bank
Bought by
Mcshane John
Home Financials for this Owner
Home Financials are based on the most recent Mortgage that was taken out on this home.
Original Mortgage
$83,000
Interest Rate
7.98%
Create a Home Valuation Report for This Property
The Home Valuation Report is an in-depth analysis detailing your home's value as well as a comparison with similar homes in the area
Home Values in the Area
Average Home Value in this Area
Purchase History
| Date | Buyer | Sale Price | Title Company |
|---|---|---|---|
| -- | -- | -- | |
| Coates Edward | $127,000 | -- | |
| Mcshane John | $87,000 | -- |
Source: Public Records
Mortgage History
| Date | Status | Borrower | Loan Amount |
|---|---|---|---|
| Previous Owner | Coates Edward | $114,300 | |
| Previous Owner | Mcshane John | $83,000 |
Source: Public Records
Tax History Compared to Growth
Tax History
| Year | Tax Paid | Tax Assessment Tax Assessment Total Assessment is a certain percentage of the fair market value that is determined by local assessors to be the total taxable value of land and additions on the property. | Land | Improvement |
|---|---|---|---|---|
| 2025 | $4,296 | $412,600 | $295,000 | $117,600 |
| 2024 | $4,296 | $195,100 | $80,000 | $115,100 |
| 2023 | $4,071 | $195,100 | $80,000 | $115,100 |
| 2022 | $4,321 | $195,100 | $80,000 | $115,100 |
| 2021 | $3,978 | $195,100 | $80,000 | $115,100 |
| 2020 | $4,117 | $195,100 | $80,000 | $115,100 |
| 2019 | $4,568 | $178,100 | $80,000 | $98,100 |
| 2018 | $4,550 | $178,100 | $80,000 | $98,100 |
| 2017 | $4,568 | $178,100 | $80,000 | $98,100 |
| 2016 | $4,263 | $178,100 | $80,000 | $98,100 |
| 2015 | $4,179 | $178,100 | $80,000 | $98,100 |
| 2014 | $4,089 | $178,100 | $80,000 | $98,100 |
Source: Public Records
Map
Nearby Homes