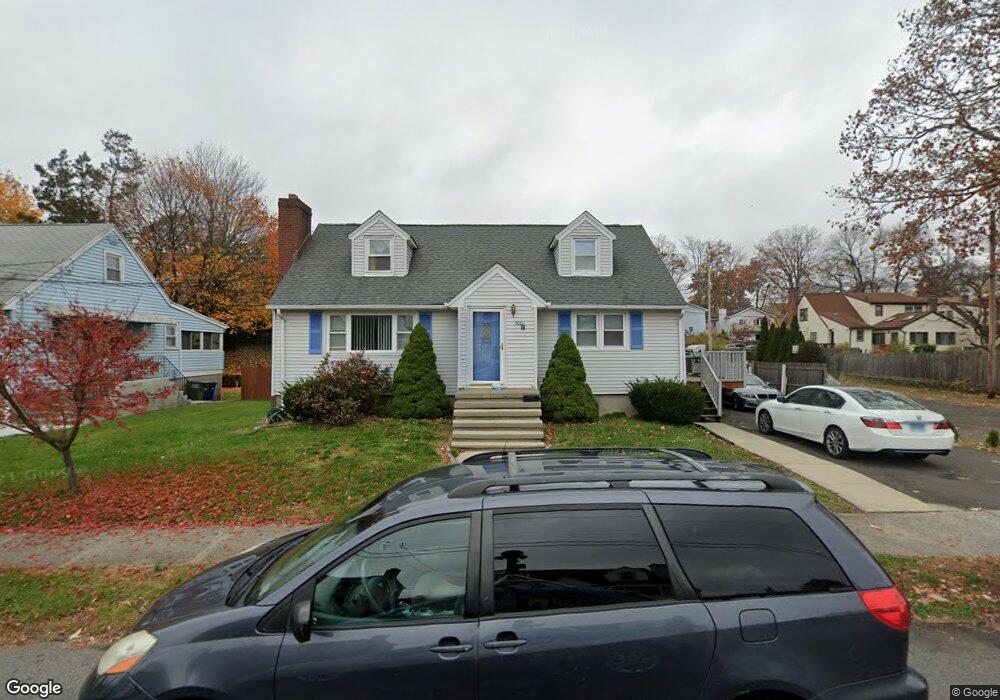
300 Clark St Bridgeport, CT 06606
North End NeighborhoodEstimated Value: $374,000 - $448,465
4
Beds
2
Baths
1,545
Sq Ft
$270/Sq Ft
Est. Value
About This Home
This home is located at 300 Clark St, Bridgeport, CT 06606 and is currently estimated at $416,866, approximately $269 per square foot. 300 Clark St is a home located in Fairfield County with nearby schools including Blackham School, Central High School, and St Andrew School.
Ownership History
Date
Name
Owned For
Owner Type
Purchase Details
Closed on
Dec 14, 1998
Sold by
Ramadanovic Peter J and Ramadanovic Kari L
Bought by
Vohra Ilyas
Current Estimated Value
Home Financials for this Owner
Home Financials are based on the most recent Mortgage that was taken out on this home.
Original Mortgage
$60,000
Outstanding Balance
$16,837
Interest Rate
6.8%
Estimated Equity
$400,029
Purchase Details
Closed on
Jul 2, 1997
Sold by
Fedorko George Est
Bought by
Ramadanovic Peter J and Ramadanovic Kari L
Home Financials for this Owner
Home Financials are based on the most recent Mortgage that was taken out on this home.
Original Mortgage
$71,400
Interest Rate
7.86%
Mortgage Type
Unknown
Create a Home Valuation Report for This Property
The Home Valuation Report is an in-depth analysis detailing your home's value as well as a comparison with similar homes in the area
Home Values in the Area
Average Home Value in this Area
Purchase History
| Date | Buyer | Sale Price | Title Company |
|---|---|---|---|
| Vohra Ilyas | $109,000 | -- | |
| Vohra Ilyas | $109,000 | -- | |
| Ramadanovic Peter J | $70,000 | -- | |
| Ramadanovic Peter J | $70,000 | -- |
Source: Public Records
Mortgage History
| Date | Status | Borrower | Loan Amount |
|---|---|---|---|
| Open | Ramadanovic Peter J | $60,000 | |
| Closed | Ramadanovic Peter J | $60,000 | |
| Previous Owner | Ramadanovic Peter J | $86,912 | |
| Previous Owner | Ramadanovic Peter J | $71,400 |
Source: Public Records
Tax History Compared to Growth
Tax History
| Year | Tax Paid | Tax Assessment Tax Assessment Total Assessment is a certain percentage of the fair market value that is determined by local assessors to be the total taxable value of land and additions on the property. | Land | Improvement |
|---|---|---|---|---|
| 2025 | $7,409 | $170,520 | $77,800 | $92,720 |
| 2024 | $7,409 | $170,520 | $77,800 | $92,720 |
| 2023 | $7,409 | $170,520 | $77,800 | $92,720 |
| 2022 | $7,409 | $170,520 | $77,800 | $92,720 |
| 2021 | $7,409 | $170,520 | $77,800 | $92,720 |
| 2020 | $6,587 | $122,010 | $44,700 | $77,310 |
| 2019 | $6,587 | $122,010 | $44,700 | $77,310 |
| 2018 | $6,634 | $122,010 | $44,700 | $77,310 |
| 2017 | $6,634 | $122,010 | $44,700 | $77,310 |
| 2016 | $6,634 | $122,010 | $44,700 | $77,310 |
| 2015 | $6,975 | $165,280 | $51,650 | $113,630 |
| 2014 | $6,975 | $165,280 | $51,650 | $113,630 |
Source: Public Records
Map
Nearby Homes
- 214 Burnsford Ave
- 260 Birmingham St
- 113 Clark St
- 184 Merritt St
- 604 Birmingham St
- 376 Savoy St
- 339 Goldenrod Ave
- 375 Ruth St
- 234 Savoy St
- 3401 Main St
- 520 Savoy St
- 1095 Wayne St
- 605 Merritt St
- 485 Westfield Ave
- 354 Beechmont Ave
- 38 Enid St Unit B
- 631 Fairview Ave
- 245 Glendale Ave Unit D8
- 495 Peet St
- 105 Tremont Ave Unit E
- 316 Clark St
- 393 Birmingham St
- 383 Birmingham St
- 324 Clark St
- 276 Clark St
- 409 Birmingham St
- 297 Clark St
- 309 Clark St
- 365 Birmingham St
- 262 Clark St
- 340 Clark St
- 427 Birmingham St
- 355 Birmingham St
- 265 Clark St
- 327 Clark St
- 250 Clark St
- 350 Clark St
- 431 Birmingham St
- 374 Thorme St
- 400 Birmingham St