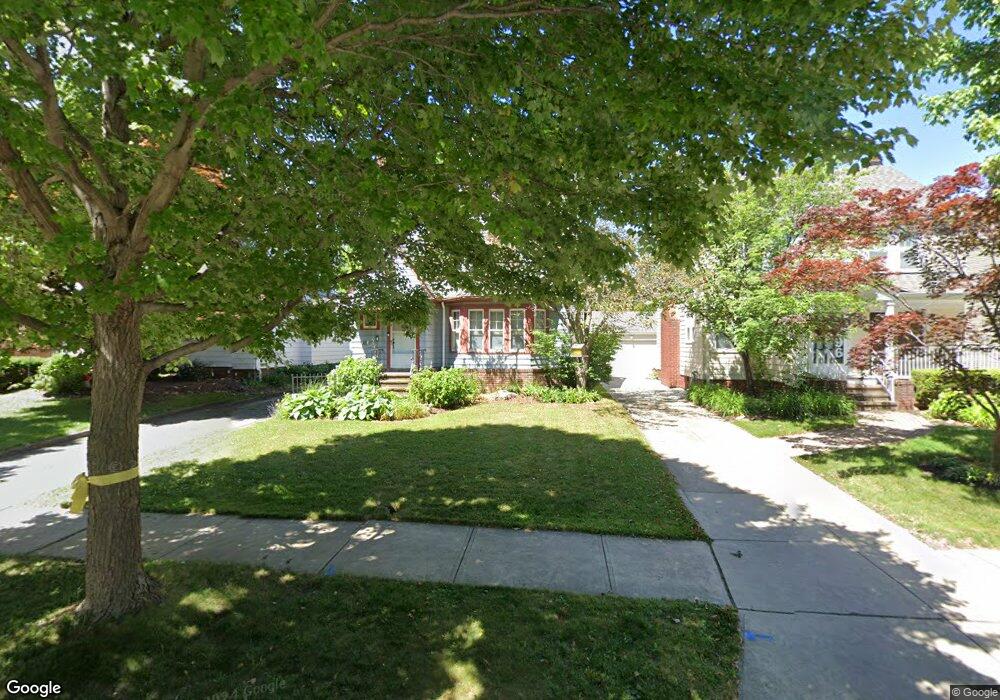
300 E 210th St Euclid, OH 44123
Estimated Value: $159,000 - $190,000
2
Beds
2
Baths
1,852
Sq Ft
$92/Sq Ft
Est. Value
About This Home
This home is located at 300 E 210th St, Euclid, OH 44123 and is currently estimated at $170,251, approximately $91 per square foot. 300 E 210th St is a home located in Cuyahoga County with nearby schools including Arbor Elementary School, Euclid Middle School, and Euclid High School.
Ownership History
Date
Name
Owned For
Owner Type
Purchase Details
Closed on
Sep 14, 2001
Sold by
Krulc Susan M and Hamilton Susan M
Bought by
Hamilton Susan M
Current Estimated Value
Home Financials for this Owner
Home Financials are based on the most recent Mortgage that was taken out on this home.
Original Mortgage
$85,700
Outstanding Balance
$31,299
Interest Rate
7.06%
Estimated Equity
$138,952
Purchase Details
Closed on
May 13, 1997
Sold by
Felt Brad A
Bought by
Krulc Susan M
Home Financials for this Owner
Home Financials are based on the most recent Mortgage that was taken out on this home.
Original Mortgage
$85,000
Interest Rate
8.05%
Mortgage Type
New Conventional
Purchase Details
Closed on
Jan 4, 1995
Sold by
Graf Mark G
Bought by
Felt Brad A and Gooding Kathryn S
Home Financials for this Owner
Home Financials are based on the most recent Mortgage that was taken out on this home.
Original Mortgage
$86,759
Interest Rate
9.27%
Mortgage Type
FHA
Purchase Details
Closed on
Jun 9, 1981
Sold by
Cooke Violette M
Bought by
Graf Mark G
Purchase Details
Closed on
Jan 1, 1975
Bought by
Cooke Violette M
Create a Home Valuation Report for This Property
The Home Valuation Report is an in-depth analysis detailing your home's value as well as a comparison with similar homes in the area
Home Values in the Area
Average Home Value in this Area
Purchase History
| Date | Buyer | Sale Price | Title Company |
|---|---|---|---|
| Hamilton Susan M | -- | Cresent Title Agency | |
| Krulc Susan M | $89,500 | -- | |
| Felt Brad A | $86,300 | -- | |
| Graf Mark G | $55,000 | -- | |
| Cooke Violette M | -- | -- |
Source: Public Records
Mortgage History
| Date | Status | Borrower | Loan Amount |
|---|---|---|---|
| Open | Hamilton Susan M | $85,700 | |
| Closed | Krulc Susan M | $85,000 | |
| Previous Owner | Felt Brad A | $86,759 |
Source: Public Records
Tax History
| Year | Tax Paid | Tax Assessment Tax Assessment Total Assessment is a certain percentage of the fair market value that is determined by local assessors to be the total taxable value of land and additions on the property. | Land | Improvement |
|---|---|---|---|---|
| 2025 | $3,818 | $57,750 | $9,100 | $48,650 |
| 2024 | $3,938 | $57,750 | $9,100 | $48,650 |
| 2023 | $3,221 | $37,420 | $6,550 | $30,870 |
| 2022 | $3,147 | $37,420 | $6,550 | $30,870 |
| 2021 | $3,512 | $37,420 | $6,550 | $30,870 |
| 2020 | $3,563 | $34,650 | $6,060 | $28,600 |
| 2019 | $3,358 | $99,000 | $17,300 | $81,700 |
| 2018 | $3,238 | $34,650 | $6,060 | $28,600 |
| 2017 | $3,470 | $31,050 | $5,080 | $25,970 |
| 2016 | $3,478 | $31,050 | $5,080 | $25,970 |
| 2015 | $3,163 | $31,050 | $5,080 | $25,970 |
| 2014 | $3,163 | $31,050 | $5,080 | $25,970 |
Source: Public Records
Map
Nearby Homes
- 273 E 208th St
- 21051 S Lake Shore Blvd
- 324 E 215th St
- 21000 Crystal Ave
- 20931 Priday Ave
- 20700 Crystal Ave
- 20900 Priday Ave
- 21670 Crystal Ave
- 144 E 208th St
- 20330 S Lake Shore Blvd
- 285 E 216th St
- 21181 Ball Ave
- 21971 Crystal Ave
- 21481 Ball Ave
- 20591 Ball Ave
- 21051 Westport Ave
- 226 E 216th St
- 115 E 211th St
- 20261 Fuller Ave
- 275 E 200th St
Your Personal Tour Guide
Ask me questions while you tour the home.