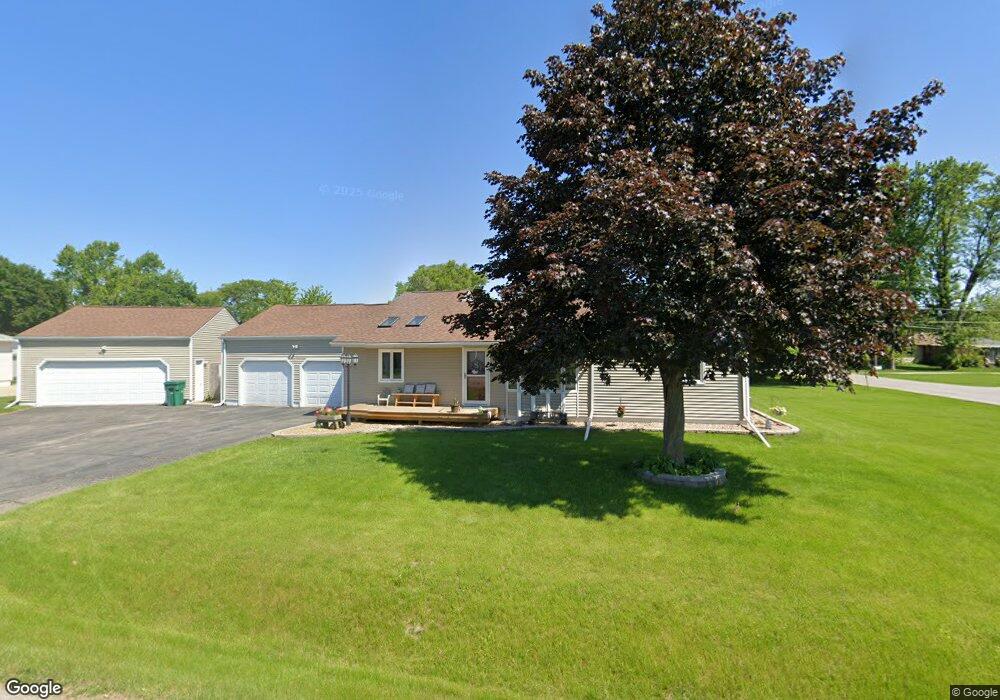
300 Elk Run St Elk Run Heights, IA 50707
Estimated Value: $274,900 - $323,000
2
Beds
3
Baths
1,584
Sq Ft
$184/Sq Ft
Est. Value
About This Home
This home is located at 300 Elk Run St, Elk Run Heights, IA 50707 and is currently estimated at $291,975, approximately $184 per square foot. 300 Elk Run St is a home located in Black Hawk County with nearby schools including Poyner Elementary School, Bunger Middle School, and East High School.
Ownership History
Date
Name
Owned For
Owner Type
Purchase Details
Closed on
Aug 12, 2021
Sold by
Saul Nicholas J and Saul Laura M
Bought by
Saul Nicholas John and Saul Laura Michelle
Current Estimated Value
Home Financials for this Owner
Home Financials are based on the most recent Mortgage that was taken out on this home.
Original Mortgage
$167,000
Outstanding Balance
$125,990
Interest Rate
2.2%
Mortgage Type
New Conventional
Estimated Equity
$165,985
Purchase Details
Closed on
Oct 8, 2015
Sold by
Schmiesing Eric J and Schmiesing April A
Bought by
Saul Nicholas J
Purchase Details
Closed on
Nov 15, 2006
Sold by
Rizner Keith A and Rizner Kim M
Bought by
Schmiesing Eric J and Schmiesing April A
Home Financials for this Owner
Home Financials are based on the most recent Mortgage that was taken out on this home.
Original Mortgage
$161,500
Interest Rate
6.36%
Mortgage Type
New Conventional
Create a Home Valuation Report for This Property
The Home Valuation Report is an in-depth analysis detailing your home's value as well as a comparison with similar homes in the area
Home Values in the Area
Average Home Value in this Area
Purchase History
| Date | Buyer | Sale Price | Title Company |
|---|---|---|---|
| Saul Nicholas John | -- | None Available | |
| Saul Nicholas J | $185,000 | None Available | |
| Schmiesing Eric J | $190,000 | None Available |
Source: Public Records
Mortgage History
| Date | Status | Borrower | Loan Amount |
|---|---|---|---|
| Open | Saul Nicholas John | $167,000 | |
| Previous Owner | Schmiesing Eric J | $161,500 |
Source: Public Records
Tax History Compared to Growth
Tax History
| Year | Tax Paid | Tax Assessment Tax Assessment Total Assessment is a certain percentage of the fair market value that is determined by local assessors to be the total taxable value of land and additions on the property. | Land | Improvement |
|---|---|---|---|---|
| 2025 | $4,082 | $300,660 | $28,570 | $272,090 |
| 2024 | $4,082 | $256,060 | $28,570 | $227,490 |
| 2023 | $3,384 | $254,870 | $28,570 | $226,300 |
| 2022 | $3,238 | $210,780 | $28,570 | $182,210 |
| 2021 | $3,282 | $210,780 | $28,570 | $182,210 |
| 2020 | $3,256 | $205,060 | $22,850 | $182,210 |
| 2019 | $3,256 | $205,060 | $22,850 | $182,210 |
| 2018 | $3,200 | $195,950 | $22,850 | $173,100 |
| 2017 | $3,290 | $195,950 | $22,850 | $173,100 |
| 2016 | $3,152 | $195,950 | $22,850 | $173,100 |
| 2015 | $3,152 | $196,460 | $22,850 | $173,610 |
| 2014 | $3,214 | $196,460 | $22,850 | $173,610 |
Source: Public Records
Map
Nearby Homes
- 30.66 Acres Mccoy Rd
- Lot 5 Lafayette Rd
- Lot 1 Lafayette Rd
- 0000 Lafayette Rd
- 1775 Michigan Dr
- Lot # 46 Hunter Dr
- Lot #45 Hunter Dr
- Lot # 47 Hunter Dr
- Lot # 53 Hunter Dr
- 1737 Enid St
- 1760 Michigan Dr
- 100 Corliss Ave
- 000 Gray St
- 000 Lafayette Rd
- 4577 Lafayette Rd
- Lot 10 Timberline Dr
- Lot 7 Timberline Dr
- 641 Amber Ln
- 525 3rd St
- 0 Dubuque Rd Unit NBR20242713