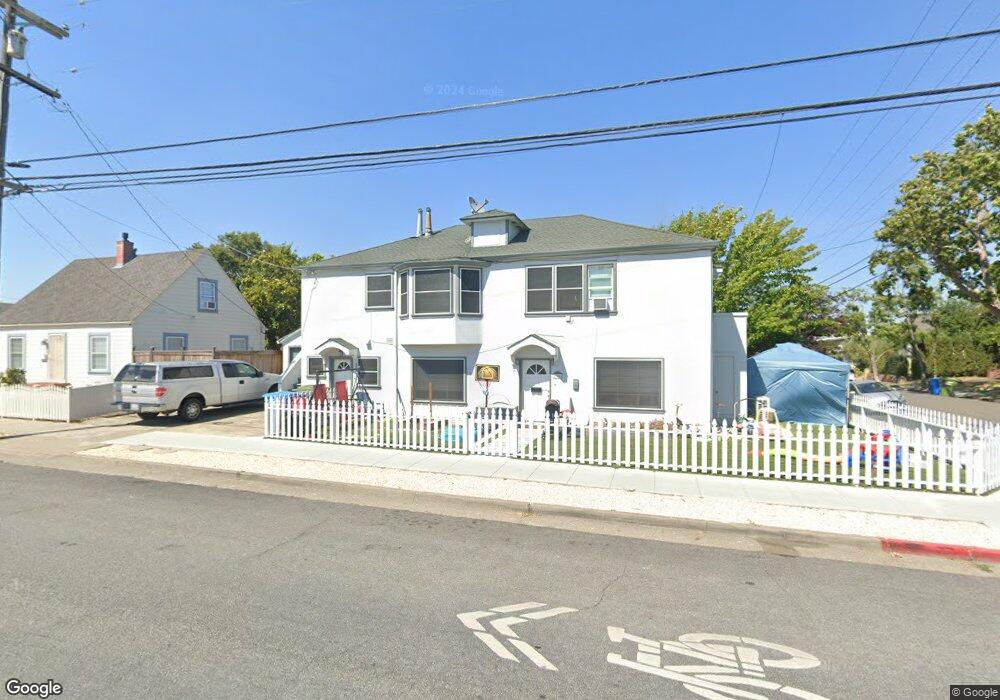
300 Fair St Petaluma, CA 94952
Western Petaluma NeighborhoodEstimated Value: $924,000 - $1,363,000
6
Beds
2
Baths
2,773
Sq Ft
$416/Sq Ft
Est. Value
About This Home
This home is located at 300 Fair St, Petaluma, CA 94952 and is currently estimated at $1,154,060, approximately $416 per square foot. 300 Fair St is a home located in Sonoma County with nearby schools including Valley Vista Elementary School, Petaluma Junior High School, and Petaluma High School.
Ownership History
Date
Name
Owned For
Owner Type
Purchase Details
Closed on
Apr 13, 2022
Sold by
Collard Jayson R
Bought by
Jayson R Collard Revocable Living Trust
Current Estimated Value
Purchase Details
Closed on
Mar 7, 2019
Sold by
Colalrd Jayson R and Collard Thora L
Bought by
Collard Jayson R
Purchase Details
Closed on
Jul 24, 1998
Sold by
Croci Richard C
Bought by
Croci Richard C and Richard C Croci Trust
Purchase Details
Closed on
Jun 11, 1993
Bought by
Croci Richard C Tr
Create a Home Valuation Report for This Property
The Home Valuation Report is an in-depth analysis detailing your home's value as well as a comparison with similar homes in the area
Home Values in the Area
Average Home Value in this Area
Purchase History
| Date | Buyer | Sale Price | Title Company |
|---|---|---|---|
| Jayson R Collard Revocable Living Trust | -- | None Listed On Document | |
| Collard Jayson R | -- | None Available | |
| Croci Richard C | -- | -- | |
| Croci Richard C Tr | $233,000 | -- |
Source: Public Records
Tax History Compared to Growth
Tax History
| Year | Tax Paid | Tax Assessment Tax Assessment Total Assessment is a certain percentage of the fair market value that is determined by local assessors to be the total taxable value of land and additions on the property. | Land | Improvement |
|---|---|---|---|---|
| 2025 | $8,800 | $814,323 | $329,075 | $485,248 |
| 2024 | $8,800 | $798,357 | $322,623 | $475,734 |
| 2023 | $8,800 | $782,704 | $316,298 | $466,406 |
| 2022 | $8,537 | $767,358 | $310,097 | $457,261 |
| 2021 | $8,376 | $752,313 | $304,017 | $448,296 |
| 2020 | $8,448 | $744,600 | $300,900 | $443,700 |
| 2019 | $4,226 | $362,645 | $163,423 | $199,222 |
| 2018 | $4,211 | $355,535 | $160,219 | $195,316 |
| 2017 | $4,124 | $348,565 | $157,078 | $191,487 |
| 2016 | $4,024 | $341,732 | $153,999 | $187,733 |
| 2015 | $3,969 | $336,600 | $151,686 | $184,914 |
| 2014 | $3,951 | $330,007 | $148,715 | $181,292 |
Source: Public Records
Map
Nearby Homes