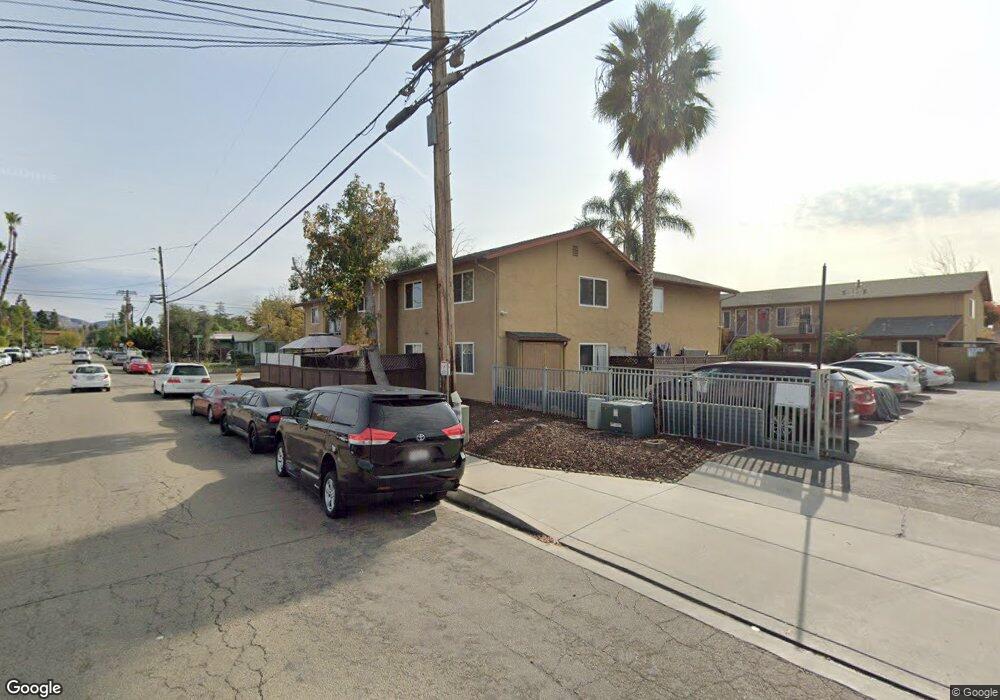
300 Filbert St Unit 3 El Cajon, CA 92020
Estimated Value: $410,000 - $534,019
3
Beds
2
Baths
904
Sq Ft
$507/Sq Ft
Est. Value
About This Home
This home is located at 300 Filbert St Unit 3, El Cajon, CA 92020 and is currently estimated at $458,005, approximately $506 per square foot. 300 Filbert St Unit 3 is a home located in San Diego County with nearby schools including Anza Elementary School, Cajon Valley Middle School, and El Cajon Valley High School.
Ownership History
Date
Name
Owned For
Owner Type
Purchase Details
Closed on
Oct 27, 2008
Sold by
Socal Condo Investments Lp
Bought by
Alpe De Vista Properties Llc
Current Estimated Value
Home Financials for this Owner
Home Financials are based on the most recent Mortgage that was taken out on this home.
Original Mortgage
$1,436,250
Outstanding Balance
$928,229
Interest Rate
5.77%
Mortgage Type
Seller Take Back
Estimated Equity
-$470,224
Purchase Details
Closed on
Jul 25, 2008
Sold by
Us Bank Na
Bought by
Socal Condo Investments Lp
Purchase Details
Closed on
Oct 11, 2007
Sold by
Napoleon Terisa and Steve Napoleon J
Bought by
Us Bank Na
Purchase Details
Closed on
Jun 5, 2005
Sold by
Filbert Verde Villas Llc
Bought by
Napoleon J Steve and Napoleon Terisa
Home Financials for this Owner
Home Financials are based on the most recent Mortgage that was taken out on this home.
Original Mortgage
$66,100
Interest Rate
5.2%
Mortgage Type
Stand Alone Second
Create a Home Valuation Report for This Property
The Home Valuation Report is an in-depth analysis detailing your home's value as well as a comparison with similar homes in the area
Purchase History
| Date | Buyer | Sale Price | Title Company |
|---|---|---|---|
| Alpe De Vista Properties Llc | -- | Chicago Title Company | |
| Socal Condo Investments Lp | $100,000 | Landamerica Commonwealth | |
| Us Bank Na | $240,000 | Accommodation | |
| Napoleon J Steve | $330,500 | Southland Title Of San Diego |
Source: Public Records
Mortgage History
| Date | Status | Borrower | Loan Amount |
|---|---|---|---|
| Open | Alpe De Vista Properties Llc | $1,436,250 | |
| Previous Owner | Napoleon J Steve | $66,100 | |
| Previous Owner | Napoleon J Steve | $264,400 |
Source: Public Records
Tax History
| Year | Tax Paid | Tax Assessment Tax Assessment Total Assessment is a certain percentage of the fair market value that is determined by local assessors to be the total taxable value of land and additions on the property. | Land | Improvement |
|---|---|---|---|---|
| 2025 | $2,889 | $128,435 | $38,623 | $89,812 |
| 2024 | $2,889 | $125,917 | $37,866 | $88,051 |
| 2023 | $2,870 | $123,449 | $37,124 | $86,325 |
| 2022 | $2,752 | $121,030 | $36,397 | $84,633 |
| 2021 | $2,662 | $118,658 | $35,684 | $82,974 |
| 2020 | $1,456 | $117,443 | $35,319 | $82,124 |
| 2019 | $1,438 | $115,141 | $34,627 | $80,514 |
| 2018 | $1,415 | $112,885 | $33,949 | $78,936 |
| 2017 | $1,397 | $110,673 | $33,284 | $77,389 |
| 2016 | $1,342 | $108,504 | $32,632 | $75,872 |
| 2015 | $1,335 | $106,875 | $32,142 | $74,733 |
| 2014 | $1,310 | $104,783 | $31,513 | $73,270 |
Source: Public Records
Map
Nearby Homes
- 469 Taft Ave
- 732 E Lexington Ave Unit 19
- 477 S Lincoln Ave
- 606 S Mollison Ave Unit A
- 300 Roanoke Rd Unit 14
- 150 S Anza St Unit 69
- 438 S Anza St
- 307 E Washington Ave
- 0 Rea Ave
- 637 Jefferson Ave
- 792 Avocado Ave Unit 26
- 792 Avocado Ave Unit 25
- 988 E Main St Unit B
- 175 E Washington Ave
- 373 Connecticut Ave
- 998 E Main St Unit 50
- 749 S Mollison Ave Unit 27
- 410 S 1st St Unit 188
- 410 S 1st St Unit 94
- 410 S 1st St Unit 156
- 300 Filbert St Unit 13
- 300 Filbert St Unit 12
- 300 Filbert St Unit 11
- 300 Filbert St Unit 10
- 300 Filbert St Unit 9
- 300 Filbert St Unit 8
- 300 Filbert St Unit 7
- 300 Filbert St Unit 6
- 300 Filbert St Unit 5
- 300 Filbert St Unit 4
- 300 Filbert St Unit 2
- 300 Filbert St Unit 1
- 326 Filbert St Unit 28
- 521 E Lexington Ave
- 605 E Lexington Ave
- 327 Taft Ave
- 317 Taft Ave
- 558 E Lexington Ave
- 609-15 E Lexington Ave
- 524 E Lexington Ave
Your Personal Tour Guide
Ask me questions while you tour the home.