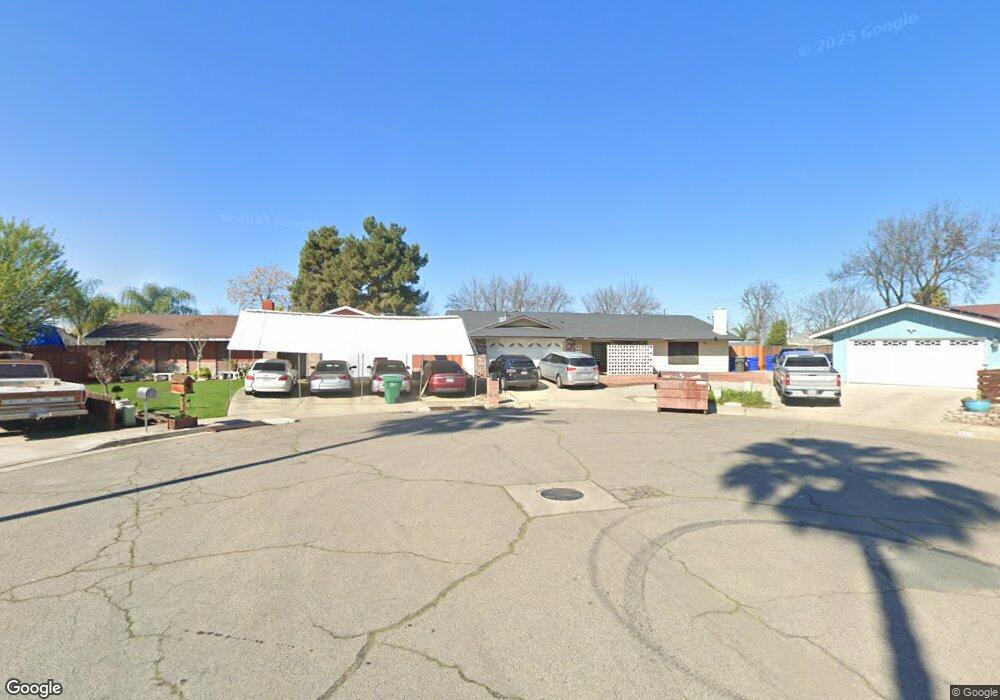
300 Heatherwood Cir Porterville, CA 93257
Porterville Northeast NeighborhoodEstimated Value: $403,681 - $485,000
6
Beds
3
Baths
2,517
Sq Ft
$176/Sq Ft
Est. Value
About This Home
This home is located at 300 Heatherwood Cir, Porterville, CA 93257 and is currently estimated at $442,170, approximately $175 per square foot. 300 Heatherwood Cir is a home located in Tulare County with nearby schools including Los Robles Elementary School, Bartlett Middle School, and Granite Hills High School.
Ownership History
Date
Name
Owned For
Owner Type
Purchase Details
Closed on
Dec 15, 2016
Sold by
Tynes Georgie I Hawley
Bought by
Denton Matthew E and Rickman Veronica L
Current Estimated Value
Home Financials for this Owner
Home Financials are based on the most recent Mortgage that was taken out on this home.
Original Mortgage
$250,000
Outstanding Balance
$204,444
Interest Rate
3.94%
Mortgage Type
Purchase Money Mortgage
Estimated Equity
$237,726
Purchase Details
Closed on
Aug 28, 2007
Sold by
Tynes Jean R
Bought by
Hawley Georgie I and Tynes Jean R
Home Financials for this Owner
Home Financials are based on the most recent Mortgage that was taken out on this home.
Original Mortgage
$47,500
Interest Rate
6.74%
Mortgage Type
Credit Line Revolving
Purchase Details
Closed on
Nov 26, 2001
Sold by
Rushing Jesse
Bought by
Hawley Georgie I
Home Financials for this Owner
Home Financials are based on the most recent Mortgage that was taken out on this home.
Original Mortgage
$115,425
Interest Rate
6.39%
Create a Home Valuation Report for This Property
The Home Valuation Report is an in-depth analysis detailing your home's value as well as a comparison with similar homes in the area
Home Values in the Area
Average Home Value in this Area
Purchase History
| Date | Buyer | Sale Price | Title Company |
|---|---|---|---|
| Denton Matthew E | $250,000 | Chicago Title Company | |
| Hawley Georgie I | -- | Financial Title Company | |
| Hawley Georgie I | $121,500 | Cuesta Title |
Source: Public Records
Mortgage History
| Date | Status | Borrower | Loan Amount |
|---|---|---|---|
| Open | Denton Matthew E | $250,000 | |
| Previous Owner | Hawley Georgie I | $47,500 | |
| Previous Owner | Hawley Georgie I | $115,425 |
Source: Public Records
Tax History Compared to Growth
Tax History
| Year | Tax Paid | Tax Assessment Tax Assessment Total Assessment is a certain percentage of the fair market value that is determined by local assessors to be the total taxable value of land and additions on the property. | Land | Improvement |
|---|---|---|---|---|
| 2025 | $3,081 | $290,144 | $58,027 | $232,117 |
| 2024 | $3,081 | $284,456 | $56,890 | $227,566 |
| 2023 | $3,079 | $278,879 | $55,775 | $223,104 |
| 2022 | $2,984 | $273,412 | $54,682 | $218,730 |
| 2021 | $2,949 | $268,051 | $53,610 | $214,441 |
| 2020 | $2,917 | $265,302 | $53,060 | $212,242 |
| 2019 | $2,865 | $260,100 | $52,020 | $208,080 |
| 2018 | $2,814 | $255,000 | $51,000 | $204,000 |
| 2017 | $2,745 | $250,000 | $50,000 | $200,000 |
| 2016 | $1,882 | $182,106 | $35,567 | $146,539 |
| 2015 | $1,722 | $171,211 | $35,033 | $136,178 |
| 2014 | $1,722 | $167,857 | $34,347 | $133,510 |
Source: Public Records
Map
Nearby Homes
- 0 E Mulberry Ave
- 917 N Esther St
- 91 Heatherwood Ct
- 740 E Mulberry Ave
- 1431 N Plano St
- 1105 N Scenic Dr
- 750 E Mulberry Ave
- 1070 N Highland Dr
- 0 N 2nd St
- 0 N Marshall St
- 534 E Morton Ave
- 481 N Sunnyside St
- 0 E Morton Unit 237726
- 0 E Morton Unit 237724
- 0 E Morton Unit 237725
- 0 N Scenic Dr Unit 237652
- 431 N Sunnyside St
- 631 N Doree Place
- 1495 N Highland Dr
- 717 Sutter Ave
- 306 Heatherwood Cir
- 303 Heatherwood Cir
- 281 E Mulberry Ave
- 291 E Mulberry Ave
- 301 E Mulberry Ave
- 310 Heatherwood Cir
- 305 Heatherwood Cir
- 311 E Mulberry Ave
- 311 Heatherwood Cir
- 320 Heatherwood Cir
- 306 Olivewood Cir
- 321 E Mulberry Ave
- 321 Heatherwood Cir
- 300 Olivewood Cir
- 330 Heatherwood Cir
- 310 Olivewood Cir
- 261 E Mulberry Ave
- 740 740 E Mulberry Ave
- 330 E Heatherwood
- 331 E Mulberry Ave