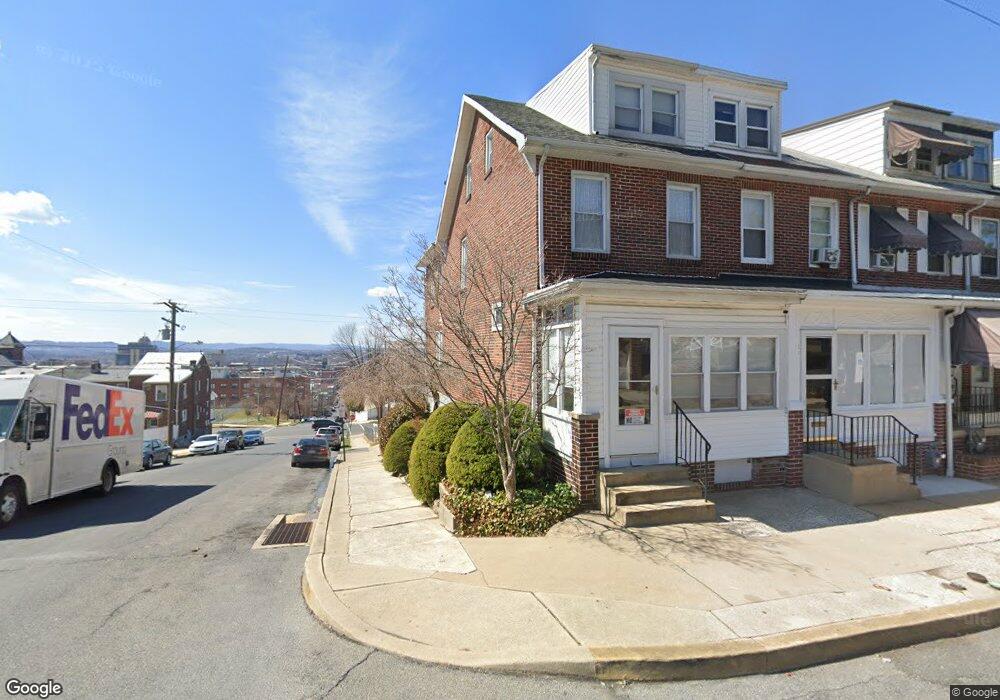
300 Linden St Reading, PA 19604
Hillside NeighborhoodEstimated Value: $154,000 - $223,000
3
Beds
2
Baths
1,722
Sq Ft
$105/Sq Ft
Est. Value
About This Home
This home is located at 300 Linden St, Reading, PA 19604 and is currently estimated at $181,261, approximately $105 per square foot. 300 Linden St is a home located in Berks County with nearby schools including 13th & Green Elementary School, Central Middle School, and Reading Senior High School.
Ownership History
Date
Name
Owned For
Owner Type
Purchase Details
Closed on
Sep 12, 2003
Sold by
Our City Reading Inc
Bought by
Focht Heidi
Current Estimated Value
Home Financials for this Owner
Home Financials are based on the most recent Mortgage that was taken out on this home.
Original Mortgage
$62,661
Interest Rate
5.9%
Mortgage Type
Purchase Money Mortgage
Purchase Details
Closed on
Feb 11, 2003
Sold by
300 Linden Street Corp
Bought by
Our City Reading Inc
Create a Home Valuation Report for This Property
The Home Valuation Report is an in-depth analysis detailing your home's value as well as a comparison with similar homes in the area
Home Values in the Area
Average Home Value in this Area
Purchase History
| Date | Buyer | Sale Price | Title Company |
|---|---|---|---|
| Focht Heidi | $64,599 | Chicago Title Insurance Comp | |
| Our City Reading Inc | $12,500 | -- |
Source: Public Records
Mortgage History
| Date | Status | Borrower | Loan Amount |
|---|---|---|---|
| Previous Owner | Focht Heidi | $62,661 |
Source: Public Records
Tax History
| Year | Tax Paid | Tax Assessment Tax Assessment Total Assessment is a certain percentage of the fair market value that is determined by local assessors to be the total taxable value of land and additions on the property. | Land | Improvement |
|---|---|---|---|---|
| 2025 | $1,262 | $46,500 | $12,000 | $34,500 |
| 2024 | $2,065 | $46,500 | $12,000 | $34,500 |
| 2023 | $2,033 | $46,500 | $12,000 | $34,500 |
| 2022 | $2,033 | $46,500 | $12,000 | $34,500 |
| 2021 | $2,033 | $46,500 | $12,000 | $34,500 |
| 2020 | $2,012 | $46,500 | $12,000 | $34,500 |
| 2019 | $2,012 | $46,500 | $12,000 | $34,500 |
| 2018 | $2,012 | $46,500 | $12,000 | $34,500 |
| 2017 | $1,999 | $46,500 | $12,000 | $34,500 |
| 2016 | $1,142 | $46,500 | $12,000 | $34,500 |
| 2015 | $1,142 | $46,500 | $12,000 | $34,500 |
| 2014 | $1,051 | $46,500 | $12,000 | $34,500 |
Source: Public Records
Map
Nearby Homes
- 268 Linden St
- 361 Linden St
- 1262 Buttonwood St
- 225 A N 14th St
- 324 N 12th St
- 441 Linden St
- 330R Locust St
- 430 N 12th St
- 424 Locust St
- 1153 Green St
- 1043 Walnut St
- 1024 Elm St
- 1027 Walnut St
- 131 Mulberry St
- 1243 Greenwich St
- 1129 Greenwich St
- 704 N 13th St
- 1125 Little Cherry St
- 1238 Eckert Ave
- 1341 Good St
Your Personal Tour Guide
Ask me questions while you tour the home.