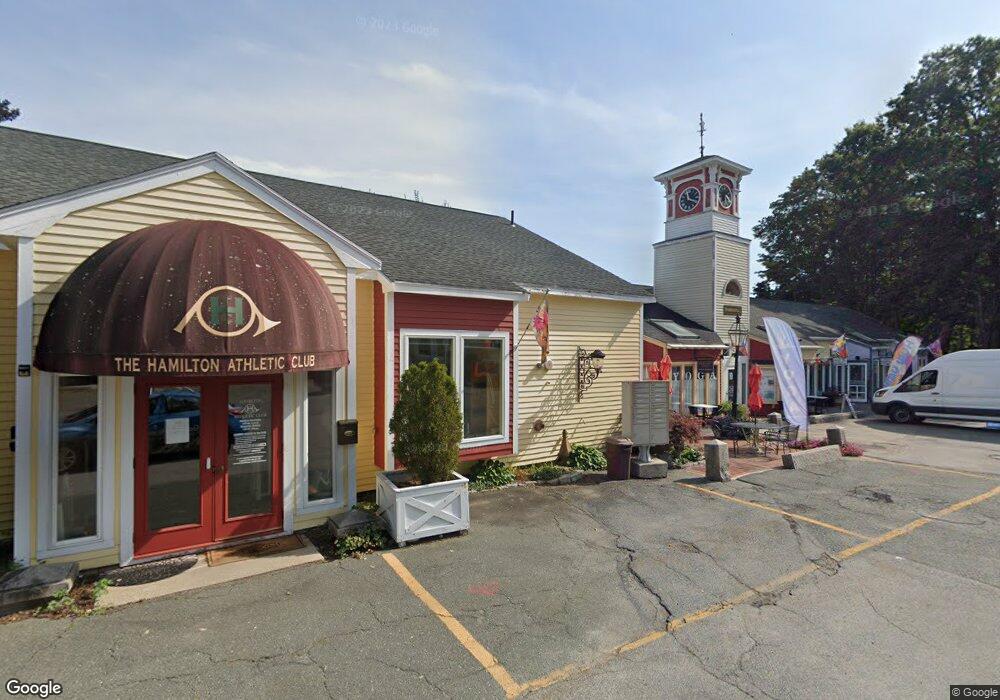
300 Main St Wenham, MA 01984
Estimated Value: $427,000
--
Bed
--
Bath
--
Sq Ft
2.3
Acres
About This Home
This home is located at 300 Main St, Wenham, MA 01984 and is currently priced at $427,000. 300 Main St is a home located in Essex County with nearby schools including Winthrop School, Cutler Elementary School, and Miles River Middle School.
Ownership History
Date
Name
Owned For
Owner Type
Purchase Details
Closed on
Nov 26, 2024
Sold by
300 At Main Rt and Robinson
Bought by
Donald L Robinson T L and Donald Mcculloch
Current Estimated Value
Purchase Details
Closed on
Feb 1, 1985
Bought by
Robinson Donald L
Create a Home Valuation Report for This Property
The Home Valuation Report is an in-depth analysis detailing your home's value as well as a comparison with similar homes in the area
Home Values in the Area
Average Home Value in this Area
Purchase History
| Date | Buyer | Sale Price | Title Company |
|---|---|---|---|
| Donald L Robinson T L | -- | None Available | |
| Donald L Robinson T L | -- | None Available | |
| Robinson Donald L | -- | -- |
Source: Public Records
Mortgage History
| Date | Status | Borrower | Loan Amount |
|---|---|---|---|
| Previous Owner | Robinson Donald L | $100,000 | |
| Previous Owner | Robinson Donald L | $75,000 |
Source: Public Records
Tax History Compared to Growth
Tax History
| Year | Tax Paid | Tax Assessment Tax Assessment Total Assessment is a certain percentage of the fair market value that is determined by local assessors to be the total taxable value of land and additions on the property. | Land | Improvement |
|---|---|---|---|---|
| 2025 | $24,696 | $1,589,200 | $565,600 | $1,023,600 |
| 2024 | $22,665 | $1,447,300 | $557,000 | $890,300 |
| 2023 | $74,327 | $4,284,000 | $1,725,000 | $2,559,000 |
| 2022 | $25,393 | $1,296,900 | $532,700 | $764,200 |
| 2021 | $24,712 | $1,255,700 | $491,500 | $764,200 |
| 2020 | $24,789 | $1,308,800 | $557,700 | $751,100 |
| 2019 | $23,585 | $1,308,800 | $557,700 | $751,100 |
| 2018 | $23,828 | $1,268,100 | $557,700 | $710,400 |
| 2017 | $23,244 | $1,268,100 | $557,700 | $710,400 |
| 2016 | $21,532 | $1,268,100 | $557,700 | $710,400 |
| 2015 | $20,607 | $1,268,100 | $557,700 | $710,400 |
Source: Public Records
Map
Nearby Homes
- 300 Main St Unit 5
- 300 Main St Unit 6
- 300 Main St Unit 7
- 300 Main St Unit 2nd fl
- 300 Main St Unit 2nd floor
- 28 Bay Rd
- 6 Bay Rd
- 44 Bay Rd
- 42 Bay Rd
- 30 Railroad Ave
- 45 Bay Rd Unit 1
- 6 Linden St
- 225 Main St
- 225 Main St Unit 8
- 225 Main St Unit 1
- 225 Main St Unit Suite 6
- 15 Walnut Rd
- 15 Walnut Rd Unit 8
- 44 Railroad Ave
- 8 Linden St