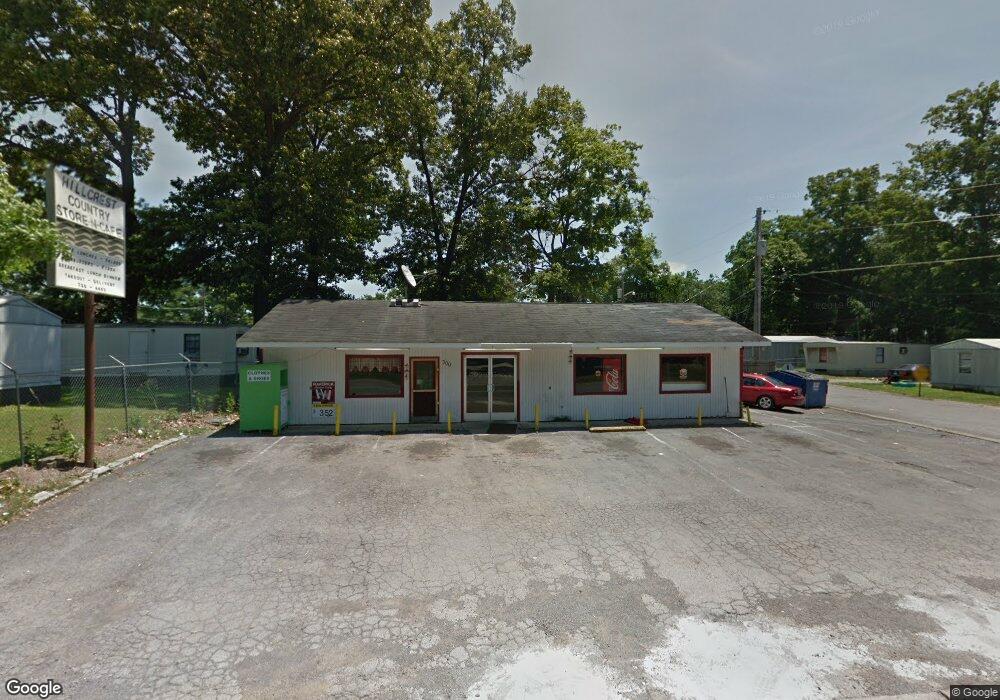
300 N Hillcrest Dr Shelbyville, TN 37160
Estimated Value: $110,113
--
Bed
--
Bath
4,800
Sq Ft
$23/Sq Ft
Est. Value
About This Home
This home is located at 300 N Hillcrest Dr, Shelbyville, TN 37160 and is currently estimated at $110,113, approximately $22 per square foot. 300 N Hillcrest Dr is a home located in Bedford County with nearby schools including Harris Middle School and Victory Baptist Academy.
Ownership History
Date
Name
Owned For
Owner Type
Purchase Details
Closed on
Jul 16, 2007
Sold by
Harris Ethel Shirlene
Bought by
Arnold Tim
Current Estimated Value
Purchase Details
Closed on
Nov 12, 1999
Sold by
Harris Ethel S and Harris Cyrstal
Bought by
Harris Ethel S
Purchase Details
Closed on
May 11, 1998
Sold by
Patel Manju A and Patel Kailesh J
Bought by
Harris Ethel S and Harris Cyrstal
Purchase Details
Closed on
Mar 25, 1998
Sold by
Patel Arvind R
Bought by
Patel Manju A and Patel Kailesh J
Purchase Details
Closed on
May 24, 1996
Sold by
Reid Frances
Bought by
Patel Arvind R and Patel Manju
Purchase Details
Closed on
Sep 25, 1990
Bought by
Reid Frances and Thomas Reid
Purchase Details
Closed on
May 2, 1989
Bought by
Reid Frances and Arnold Timothy S
Purchase Details
Closed on
Feb 27, 1987
Bought by
Williams Roger D and Williams Paralee S
Purchase Details
Closed on
Nov 7, 1986
Bought by
Farrar James E
Create a Home Valuation Report for This Property
The Home Valuation Report is an in-depth analysis detailing your home's value as well as a comparison with similar homes in the area
Home Values in the Area
Average Home Value in this Area
Purchase History
| Date | Buyer | Sale Price | Title Company |
|---|---|---|---|
| Arnold Tim | $43,975 | -- | |
| Harris Ethel S | -- | -- | |
| Harris Ethel S | $60,000 | -- | |
| Patel Manju A | -- | -- | |
| Patel Arvind R | $95,000 | -- | |
| Reid Frances | $5,000 | -- | |
| Reid Frances | -- | -- | |
| Williams Roger D | -- | -- | |
| Farrar James E | -- | -- |
Source: Public Records
Tax History Compared to Growth
Tax History
| Year | Tax Paid | Tax Assessment Tax Assessment Total Assessment is a certain percentage of the fair market value that is determined by local assessors to be the total taxable value of land and additions on the property. | Land | Improvement |
|---|---|---|---|---|
| 2025 | -- | $21,440 | $0 | $0 |
| 2024 | -- | $21,440 | $6,000 | $15,440 |
| 2023 | $816 | $21,440 | $6,000 | $15,440 |
| 2022 | $840 | $21,440 | $6,000 | $15,440 |
| 2021 | $762 | $21,440 | $6,000 | $15,440 |
| 2020 | $888 | $21,440 | $6,000 | $15,440 |
| 2019 | $888 | $20,040 | $3,960 | $16,080 |
| 2018 | $868 | $20,040 | $3,960 | $16,080 |
| 2017 | $868 | $20,040 | $3,960 | $16,080 |
| 2016 | $860 | $20,040 | $3,960 | $16,080 |
| 2015 | $860 | $20,040 | $3,960 | $16,080 |
| 2014 | $731 | $18,646 | $0 | $0 |
Source: Public Records
Map
Nearby Homes
- 204 S Hillcrest Dr
- 225 Eagle Blvd
- 1404 Cypress St
- 1683 Madison St
- 104 Curbow Ct
- 1725 Wartrace Pike
- 108 Virginia Ct
- 11 Amos Smith Rd
- 1024 Tennessee 64
- 807 Shoma Dr
- 107 Rockwood Dr
- 314 Maplewood Dr
- 207 Ledbetter Rd
- 705 S Wall St
- 707 S Wall St
- 2021 Madison St
- 404 Ledbetter Rd
- 967 Horse Mountain Rd Unit 1E
- 967 Horse Mountain Rd Unit 3-G
- 1747 Park Place Plan at Park Place
- 104 N Hillcrest Dr
- 502 N Hillcrest Dr
- 1 Madison St
- 1307 Madison St
- 1307 Madison St
- 1400 Madison St
- 1303 Madison St
- 1314 Madison St
- 1401 Cherry St
- 1403 Cherry St
- 1405 Cherry St
- 1299 Madison St
- 1407 Cherry St
- 1409 Cherry St
- 200 S Hillcrest Dr
- 1411 Cherry St
- 1301 Madison St
- 1304 Madison St
- 1 Cherry St
- 202 S Hillcrest Dr