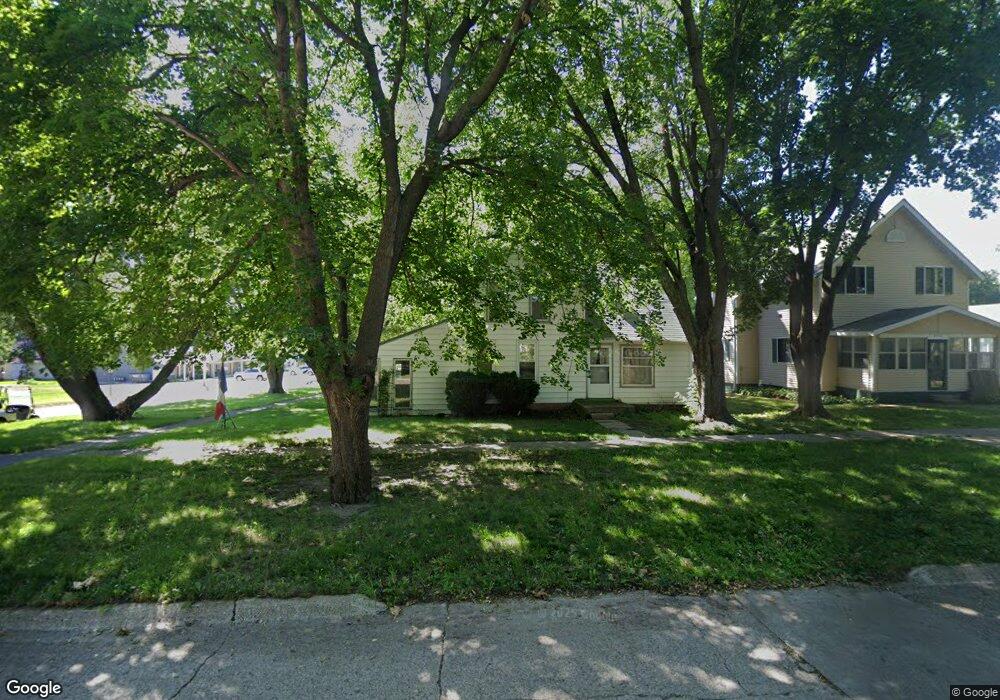
300 N Maple St Marcus, IA 51035
Estimated Value: $49,913 - $151,000
3
Beds
3
Baths
1,283
Sq Ft
$90/Sq Ft
Est. Value
About This Home
This home is located at 300 N Maple St, Marcus, IA 51035 and is currently estimated at $115,728, approximately $90 per square foot. 300 N Maple St is a home located in Cherokee County with nearby schools including MMCRU Marcus Elementary School and MMCRU High School.
Ownership History
Date
Name
Owned For
Owner Type
Purchase Details
Closed on
Oct 16, 2025
Sold by
Siouxland Equity Llc
Bought by
Hindman Zachary
Current Estimated Value
Purchase Details
Closed on
Sep 17, 2025
Sold by
Smith Alvin L and Dreckman Denise J
Bought by
Siouxland Equity Llc
Purchase Details
Closed on
Jul 3, 2007
Sold by
Smith Alvin L and Smith Donna J
Bought by
Smith Alvin L
Purchase Details
Closed on
Aug 18, 2006
Sold by
Rosewall Ronald D and Rosewall Melinda R
Bought by
Hammond Thomas L and Hammond Jessica L
Home Financials for this Owner
Home Financials are based on the most recent Mortgage that was taken out on this home.
Original Mortgage
$87,500
Interest Rate
6.78%
Mortgage Type
New Conventional
Create a Home Valuation Report for This Property
The Home Valuation Report is an in-depth analysis detailing your home's value as well as a comparison with similar homes in the area
Home Values in the Area
Average Home Value in this Area
Purchase History
| Date | Buyer | Sale Price | Title Company |
|---|---|---|---|
| Hindman Zachary | $33,000 | None Listed On Document | |
| Siouxland Equity Llc | $8,000 | None Listed On Document | |
| Smith Alvin L | -- | None Available | |
| Hammond Thomas L | $87,500 | None Available |
Source: Public Records
Mortgage History
| Date | Status | Borrower | Loan Amount |
|---|---|---|---|
| Previous Owner | Hammond Thomas L | $87,500 |
Source: Public Records
Tax History Compared to Growth
Tax History
| Year | Tax Paid | Tax Assessment Tax Assessment Total Assessment is a certain percentage of the fair market value that is determined by local assessors to be the total taxable value of land and additions on the property. | Land | Improvement |
|---|---|---|---|---|
| 2025 | -- | $25,670 | $8,820 | $16,850 |
| 2024 | -- | $24,320 | $8,820 | $15,500 |
| 2023 | $138 | $24,320 | $8,820 | $15,500 |
| 2022 | $138 | $20,720 | $8,820 | $11,900 |
| 2021 | $138 | $20,720 | $8,820 | $11,900 |
| 2020 | $138 | $20,720 | $8,820 | $11,900 |
| 2019 | $146 | $20,720 | $0 | $0 |
| 2018 | $230 | $26,089 | $0 | $0 |
| 2017 | $230 | $26,089 | $0 | $0 |
| 2016 | $242 | $26,089 | $0 | $0 |
| 2015 | $188 | $22,298 | $0 | $0 |
| 2014 | $184 | $22,298 | $0 | $0 |
Source: Public Records
Map
Nearby Homes
- 300 N Maple St
- 302 N Maple St
- 304 N Maple St
- 304 N Maple St
- 206 N Maple St
- 210 W Pine St
- 301 N Walnut St
- 209 W Pine St
- 303 N Maple St
- 303 N Walnut St
- 305 N Maple St
- 204 N Maple St
- 310 N Maple St
- 310 N Maple St Unit St
- 209 N Maple St
- 307 N Maple St
- 205 N Walnut St
- 108 W Pine St
- 309 N Maple St
- 305 N Walnut St