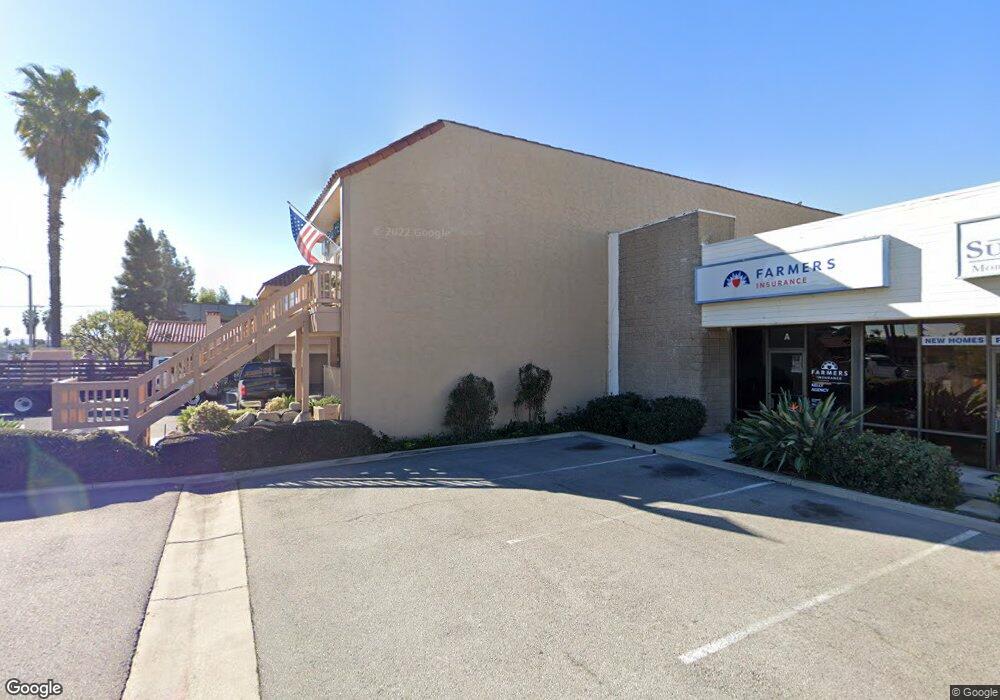
300 N Tustin Ave Unit 101 Santa Ana, CA 92705
Portola Park NeighborhoodEstimated Value: $2,567,288
--
Bed
--
Bath
9,950
Sq Ft
$258/Sq Ft
Est. Value
About This Home
This home is located at 300 N Tustin Ave Unit 101, Santa Ana, CA 92705 and is currently estimated at $2,567,288, approximately $258 per square foot. 300 N Tustin Ave Unit 101 is a home located in Orange County with nearby schools including Helen Estock Elementary School, Columbus Tustin Middle School, and Foothill High School.
Ownership History
Date
Name
Owned For
Owner Type
Purchase Details
Closed on
May 12, 2014
Sold by
Regent Investment Holdings Llc
Bought by
Swp Rentals Inc
Current Estimated Value
Purchase Details
Closed on
Mar 4, 2010
Sold by
Binette Annette A
Bought by
Regent Investment Holdings Llc
Home Financials for this Owner
Home Financials are based on the most recent Mortgage that was taken out on this home.
Original Mortgage
$239,000
Interest Rate
4.88%
Mortgage Type
Commercial
Purchase Details
Closed on
Mar 26, 2009
Sold by
Binette Annette A
Bought by
Binette Annette A
Purchase Details
Closed on
Feb 24, 2003
Sold by
Piazza Joseph
Bought by
Binette Herve M and Binette Annette A
Home Financials for this Owner
Home Financials are based on the most recent Mortgage that was taken out on this home.
Original Mortgage
$1,050,000
Interest Rate
5.93%
Mortgage Type
Seller Take Back
Create a Home Valuation Report for This Property
The Home Valuation Report is an in-depth analysis detailing your home's value as well as a comparison with similar homes in the area
Home Values in the Area
Average Home Value in this Area
Purchase History
| Date | Buyer | Sale Price | Title Company |
|---|---|---|---|
| Swp Rentals Inc | $1,250,000 | Orange Coast Title Company | |
| Regent Investment Holdings Llc | $1,239,000 | First American Title Ins Co | |
| Binette Annette A | -- | None Available | |
| Binette Herve M | $1,750,000 | American Title Co |
Source: Public Records
Mortgage History
| Date | Status | Borrower | Loan Amount |
|---|---|---|---|
| Previous Owner | Regent Investment Holdings Llc | $239,000 | |
| Previous Owner | Binette Herve M | $1,050,000 |
Source: Public Records
Tax History Compared to Growth
Tax History
| Year | Tax Paid | Tax Assessment Tax Assessment Total Assessment is a certain percentage of the fair market value that is determined by local assessors to be the total taxable value of land and additions on the property. | Land | Improvement |
|---|---|---|---|---|
| 2025 | $17,533 | $1,532,324 | $784,554 | $747,770 |
| 2024 | $17,533 | $1,502,279 | $769,171 | $733,108 |
| 2023 | $17,128 | $1,472,823 | $754,089 | $718,734 |
| 2022 | $16,890 | $1,443,945 | $739,303 | $704,642 |
| 2021 | $16,553 | $1,415,633 | $724,807 | $690,826 |
| 2020 | $16,462 | $1,401,118 | $717,375 | $683,743 |
| 2019 | $16,068 | $1,373,646 | $703,309 | $670,337 |
| 2018 | $15,805 | $1,346,712 | $689,518 | $657,194 |
| 2017 | $15,530 | $1,320,306 | $675,998 | $644,308 |
| 2016 | $15,252 | $1,294,418 | $662,743 | $631,675 |
| 2015 | $15,118 | $1,274,975 | $652,788 | $622,187 |
| 2014 | $15,309 | $1,304,656 | $652,855 | $651,801 |
Source: Public Records
Map
Nearby Homes
- 155 Pasadena Ave
- 157 Pacific St
- 1882 E 1st St Unit 260
- 1818 E 1st St Unit 520
- Plan 3 at Cabrillo Crossing
- Plan 1 at Cabrillo Crossing
- Plan 4 at Cabrillo Crossing
- Plan 2 at Cabrillo Crossing
- 1814 E 1st St Unit 320
- 1812 E 1st St Unit 200
- 1812 E 1st St Unit 280
- 1810 E 1st St Unit 29
- 654 W Main St Unit B
- 141 E Coronado Ln
- 107 S Portola Ln Unit 41
- 158 E De Anza Ln Unit 175
- 160 N B St
- 129 Colombo Ln
- 131 Colombo Ln
- 631 W 6th St Unit D
- 300 N Tustin Ave
- 300 N Tustin Ave Unit 200
- 300 N Tustin Ave Unit 201
- 300 N Tustin Ave Unit 100
- 220 N Tustin Ave
- 310 N Tustin Ave
- 320 N Tustin Ave
- 171 N Tustin Ave
- 301 N Tustin Ave
- 302 N Tustin Ave
- 302 N Tustin Ave Unit 101
- 302 N Tustin Ave Unit 201
- 302 N Tustin Ave Unit 200
- 100 N Tustin Ave
- 2151 E 1st St
- 2151 E 1st St Unit 77
- 19 N Tustin Ave
- 2321 E 4th St
- 2131 E 1st St
- 2101 E 4th St