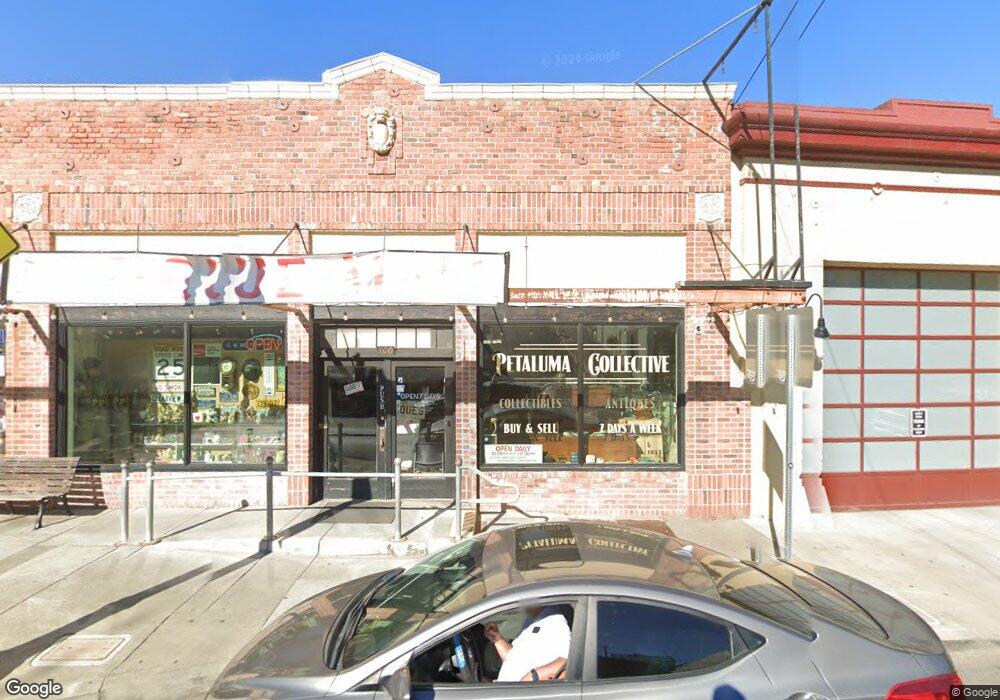
300 Petaluma Blvd N Petaluma, CA 94952
Downtown Petaluma NeighborhoodEstimated Value: $1,626,024
--
Bed
--
Bath
13,464
Sq Ft
$121/Sq Ft
Est. Value
About This Home
This home is located at 300 Petaluma Blvd N, Petaluma, CA 94952 and is currently estimated at $1,626,024, approximately $120 per square foot. 300 Petaluma Blvd N is a home located in Sonoma County with nearby schools including McKinley Elementary School, Petaluma Junior High School, and Petaluma High School.
Ownership History
Date
Name
Owned For
Owner Type
Purchase Details
Closed on
Nov 2, 2021
Sold by
Petersen H Wally H and Petersen Cynthia
Bought by
Asfour Izzat and Asfour Hala
Current Estimated Value
Home Financials for this Owner
Home Financials are based on the most recent Mortgage that was taken out on this home.
Original Mortgage
$575,000
Outstanding Balance
$526,078
Interest Rate
2.88%
Mortgage Type
Seller Take Back
Estimated Equity
$1,099,946
Purchase Details
Closed on
Jan 6, 2005
Sold by
Numark Natalie R
Bought by
Numark Natalie R and Natalie R Numark Revocable Tru
Purchase Details
Closed on
Feb 16, 1999
Sold by
Perry Alexander S and Perry Paul James
Bought by
Numark Charles A and Numark Natalie R
Home Financials for this Owner
Home Financials are based on the most recent Mortgage that was taken out on this home.
Original Mortgage
$390,000
Interest Rate
6.78%
Mortgage Type
Commercial
Create a Home Valuation Report for This Property
The Home Valuation Report is an in-depth analysis detailing your home's value as well as a comparison with similar homes in the area
Home Values in the Area
Average Home Value in this Area
Purchase History
| Date | Buyer | Sale Price | Title Company |
|---|---|---|---|
| Asfour Izzat | $1,525,000 | First American Title Company | |
| Numark Natalie R | -- | -- | |
| Numark Charles A | $520,000 | First American Title | |
| Perry Paul James | -- | First American Title | |
| Perry Alexander Stephen | -- | First American Title |
Source: Public Records
Mortgage History
| Date | Status | Borrower | Loan Amount |
|---|---|---|---|
| Open | Asfour Izzat | $575,000 | |
| Previous Owner | Numark Charles A | $390,000 |
Source: Public Records
Tax History Compared to Growth
Tax History
| Year | Tax Paid | Tax Assessment Tax Assessment Total Assessment is a certain percentage of the fair market value that is determined by local assessors to be the total taxable value of land and additions on the property. | Land | Improvement |
|---|---|---|---|---|
| 2025 | $17,231 | $1,618,342 | $424,483 | $1,193,859 |
| 2024 | $17,231 | $1,586,610 | $416,160 | $1,170,450 |
| 2023 | $17,231 | $1,555,500 | $408,000 | $1,147,500 |
| 2022 | $9,340 | $842,067 | $147,725 | $694,342 |
| 2021 | $9,164 | $825,557 | $144,829 | $680,728 |
| 2020 | $9,243 | $817,092 | $143,344 | $673,748 |
| 2019 | $9,129 | $801,072 | $140,534 | $660,538 |
| 2018 | $9,094 | $785,366 | $137,779 | $647,587 |
| 2017 | $8,904 | $769,968 | $135,078 | $634,890 |
| 2016 | $8,697 | $754,872 | $132,430 | $622,442 |
| 2015 | -- | $743,534 | $130,441 | $613,093 |
| 2014 | -- | $728,970 | $127,886 | $601,084 |
Source: Public Records
Map
Nearby Homes
- 210 Keller St
- 331 Keller St Unit 11
- 505 Petaluma Blvd N
- 131 Liberty St
- 136 Court St
- Plan 3 Craftsman at Riverbend Petaluma - Wine Country Collection
- 65 Riverbend Ln
- 543 Madison St
- 304 West St
- 416 C St
- 531 E Washington St
- 618 Galland St
- 411 Cherry St
- 495 Cherry St
- 26 Wallace Ct
- 0 Lakeville St
- 811 D St
- 513 Larch Dr
- 1252 Petaluma Blvd N
- 125 Acorn Dr
- 326 Petaluma Blvd N
- 246 Petaluma Blvd N
- 300 Kentucky St
- 14 Martha St
- 304 Kentucky St
- 308 Kentucky St
- 314 Kentucky St
- 318 Kentucky St
- 242 Petaluma Blvd
- 322 Kentucky St
- 100 Prospect St
- 326 Kentucky St
- 253 Kentucky St
- 226 Petaluma Blvd N
- 249 Kentucky St Unit B 1 bedroo
- 249 Kentucky St
- 245 Kentucky St
- 330 Kentucky St
- 309 Kentucky St
- 356 Petaluma Blvd N