Estimated Value: $426,070 - $527,000
5
Beds
4
Baths
3,746
Sq Ft
$130/Sq Ft
Est. Value
About This Home
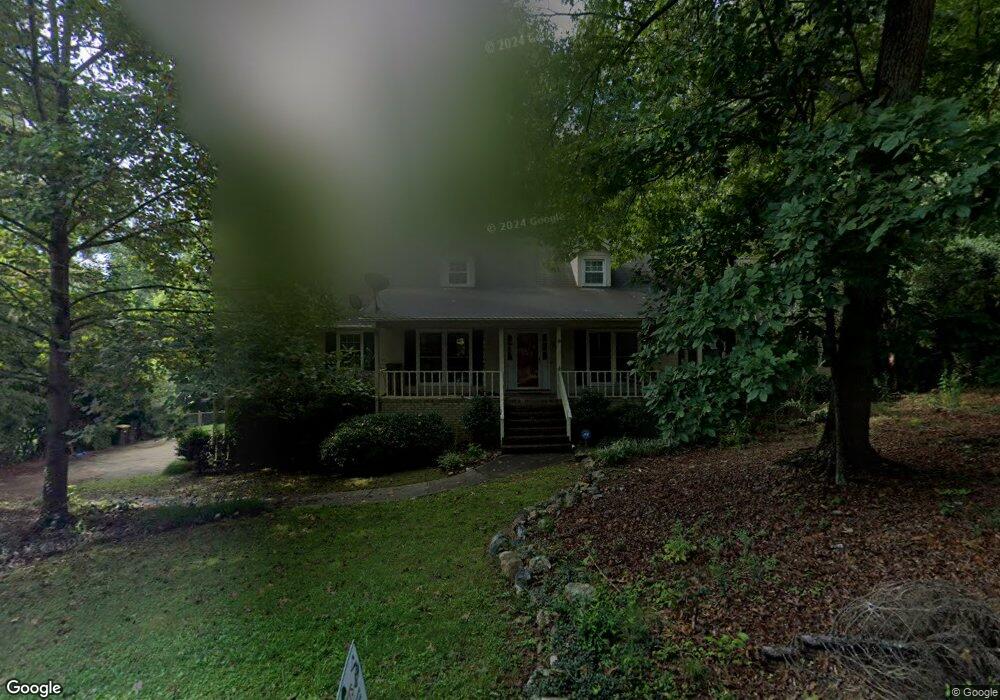
This home is located at 300 Pheasant Run SE, Rome, GA 30161 and is currently estimated at $488,268, approximately $130 per square foot. 300 Pheasant Run SE is a home located in Floyd County with nearby schools including Rome High School, Montessori School of Rome, and St. Mary School.
Ownership History
Date
Name
Owned For
Owner Type
Purchase Details
Closed on
Dec 27, 2017
Sold by
Davis Darren L
Bought by
Sho Yosuke and Sho Katharine
Current Estimated Value
Home Financials for this Owner
Home Financials are based on the most recent Mortgage that was taken out on this home.
Original Mortgage
$225,250
Outstanding Balance
$188,100
Interest Rate
3.9%
Mortgage Type
New Conventional
Estimated Equity
$300,168
Purchase Details
Closed on
Mar 20, 2009
Sold by
Farmer Thomas H R
Bought by
Davis Darren L
Home Financials for this Owner
Home Financials are based on the most recent Mortgage that was taken out on this home.
Original Mortgage
$243,950
Interest Rate
5.1%
Mortgage Type
New Conventional
Purchase Details
Closed on
Jun 21, 2002
Bought by
P and R
Purchase Details
Closed on
Apr 1, 1997
Sold by
Rogers Rhett and Renee Rogers
Bought by
Farmer Thomas H and Farmer R
Purchase Details
Closed on
Jul 3, 1995
Sold by
Gomillion Robert G and Gomillion Janis
Bought by
Rogers Rhett and Renee Rogers
Purchase Details
Closed on
Jun 17, 1977
Sold by
N R S Properties Inc
Bought by
Gomillion Robert G and Gomillion Janis
Purchase Details
Closed on
Jan 30, 1973
Bought by
N R S Properties Inc
Create a Home Valuation Report for This Property
The Home Valuation Report is an in-depth analysis detailing your home's value as well as a comparison with similar homes in the area
Home Values in the Area
Average Home Value in this Area
Purchase History
| Date | Buyer | Sale Price | Title Company |
|---|---|---|---|
| Sho Yosuke | $265,000 | -- | |
| Davis Darren L | $287,000 | -- | |
| P | -- | -- | |
| Farmer Thomas H | $235,000 | -- | |
| Rogers Rhett | $187,500 | -- | |
| Gomillion Robert G | $89,500 | -- | |
| N R S Properties Inc | -- | -- |
Source: Public Records
Mortgage History
| Date | Status | Borrower | Loan Amount |
|---|---|---|---|
| Open | Sho Yosuke | $225,250 | |
| Previous Owner | Davis Darren L | $243,950 |
Source: Public Records
Tax History
| Year | Tax Paid | Tax Assessment Tax Assessment Total Assessment is a certain percentage of the fair market value that is determined by local assessors to be the total taxable value of land and additions on the property. | Land | Improvement |
|---|---|---|---|---|
| 2025 | $4,357 | $168,325 | $26,484 | $141,841 |
| 2024 | $4,357 | $157,526 | $24,077 | $133,449 |
| 2023 | $4,327 | $156,371 | $21,402 | $134,969 |
| 2022 | $4,003 | $131,134 | $17,389 | $113,745 |
| 2021 | $3,892 | $121,131 | $17,389 | $103,742 |
| 2020 | $3,835 | $116,245 | $13,376 | $102,869 |
| 2019 | $3,547 | $101,756 | $13,376 | $88,380 |
| 2018 | $3,393 | $92,941 | $13,376 | $79,565 |
| 2017 | $3,292 | $88,927 | $13,376 | $75,551 |
| 2016 | $3,629 | $97,720 | $13,360 | $84,360 |
| 2015 | $3,281 | $92,560 | $13,360 | $79,200 |
| 2014 | $3,281 | $93,558 | $13,360 | $80,198 |
Source: Public Records
Map
Nearby Homes
- 227 Pheasant Run SE
- 412 Pheasant Run SE
- 214 Saddle Mountain Rd SE
- 36 Saddle Mountain Rd SE
- 418 Flora Ext Ave
- 409 Flora Ave SE
- 2827 Maple Rd SE
- 2812 Maple Rd SE
- 212 Alfred Ave SE
- 27 Saddle Mountain Rd SE
- 733 Chateau Dr SE
- 2710 Maple Rd SE
- 15 Saddlebrook Dr SE
- 14 Saddlebrook Dr SE
- 33 Summit Dr
- 206 Hooper Ave SE
- 206C Hooper Ave SE
- 2523 Maple Rd SE
- 0 Wellington Way SE Unit 10693561
- 0 Wellington Way SE Unit 7721620
- 302 Pheasant Run SE
- 232 Pheasant Run SE
- 232 Pheasant Run SE
- 2 Wren Place SE
- 304 Pheasant Run SE
- 1 Wren Place SE
- S Pheasant Run
- 230 Pheasant Run SE
- 306 Pheasant Run SE
- 4 Wren Place SE
- 1 Quail Hollow SE
- 231 Pheasant Run SE Unit 115
- 231 Pheasant Run SE
- 3 Wren Place SE
- 14 Mccord Dr SE
- 7 Mccord Dr SE
- 3 Quail Hollow SE
- 3 Quail Hollow SE
- 3 Quail Hollow SE Unit 125/126
- 400 Pheasant Run SE
Your Personal Tour Guide
Ask me questions while you tour the home.