Estimated Value: $83,000 - $190,000
3
Beds
2
Baths
1,684
Sq Ft
$80/Sq Ft
Est. Value
About This Home
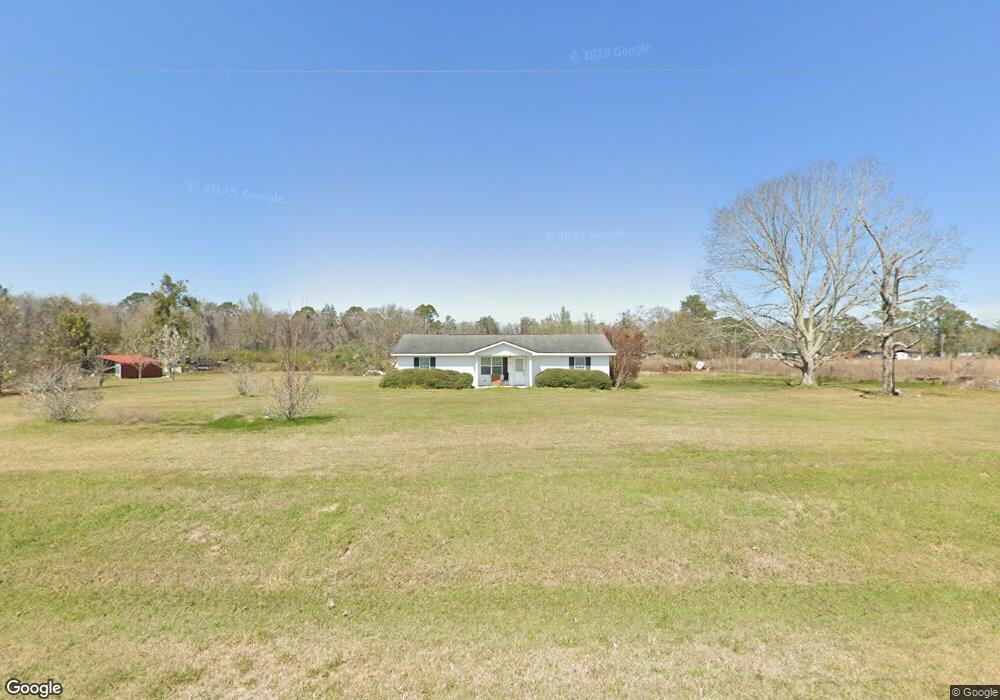
This home is located at 300 Quillie Jones Rd, Adel, GA 31620 and is currently estimated at $134,995, approximately $80 per square foot. 300 Quillie Jones Rd is a home located in Cook County with nearby schools including Cook Primary School, Cook Elementary School, and Cook County Middle School.
Ownership History
Date
Name
Owned For
Owner Type
Purchase Details
Closed on
Apr 22, 2015
Sold by
Jpmorgan Chase Bank Nation
Bought by
Southland Properties Llc
Current Estimated Value
Home Financials for this Owner
Home Financials are based on the most recent Mortgage that was taken out on this home.
Original Mortgage
$49,569
Interest Rate
3.79%
Mortgage Type
New Conventional
Purchase Details
Closed on
Mar 4, 2014
Sold by
Moore Jeremy Chad
Bought by
Jpmorgan Chase Bank National A
Purchase Details
Closed on
Jul 17, 2009
Sold by
Land Edgar L
Bought by
Moore Jeremy Chad
Home Financials for this Owner
Home Financials are based on the most recent Mortgage that was taken out on this home.
Original Mortgage
$78,522
Interest Rate
5.53%
Mortgage Type
New Conventional
Purchase Details
Closed on
Sep 20, 2007
Sold by
Page Mervin Lamar
Bought by
Land Edgar L
Create a Home Valuation Report for This Property
The Home Valuation Report is an in-depth analysis detailing your home's value as well as a comparison with similar homes in the area
Home Values in the Area
Average Home Value in this Area
Purchase History
| Date | Buyer | Sale Price | Title Company |
|---|---|---|---|
| Southland Properties Llc | $47,500 | -- | |
| Jpmorgan Chase Bank National A | -- | -- | |
| Moore Jeremy Chad | $72,000 | -- | |
| Land Edgar L | $56,100 | -- |
Source: Public Records
Mortgage History
| Date | Status | Borrower | Loan Amount |
|---|---|---|---|
| Closed | Southland Properties Llc | $49,569 | |
| Previous Owner | Moore Jeremy Chad | $78,522 |
Source: Public Records
Tax History Compared to Growth
Tax History
| Year | Tax Paid | Tax Assessment Tax Assessment Total Assessment is a certain percentage of the fair market value that is determined by local assessors to be the total taxable value of land and additions on the property. | Land | Improvement |
|---|---|---|---|---|
| 2024 | $1,011 | $37,547 | $1,865 | $35,682 |
| 2023 | $871 | $32,332 | $1,865 | $30,467 |
| 2022 | $911 | $33,808 | $3,341 | $30,467 |
| 2021 | $808 | $27,969 | $3,341 | $24,628 |
| 2020 | $808 | $27,969 | $3,341 | $24,628 |
| 2019 | $808 | $27,969 | $3,341 | $24,628 |
| 2018 | $809 | $27,969 | $3,341 | $24,628 |
| 2017 | $809 | $27,969 | $3,341 | $24,628 |
| 2016 | $550 | $30,063 | $3,341 | $26,722 |
| 2015 | $816 | $30,062 | $3,341 | $26,722 |
| 2014 | $818 | $30,062 | $3,341 | $26,722 |
| 2013 | -- | $30,062 | $3,340 | $26,721 |
Source: Public Records
Map
Nearby Homes
- 289 Arthur Newbern Rd
- TBD Ga Hwy 76
- TBD Hwy 76
- 25 Stephen Williams Ln
- 2590 McConnell Bridge Rd
- 421 Best Cir
- 3231 Old Quitman Rd
- 0 Georgia 76
- 515 John Keigans Memorial
- 7051 Antioch Rd
- 11 Antioch Rd
- 800 Old Quitman Rd
- 4711 Highway 37
- 729 W 7th St
- 123 Westover Dr
- 120 Westover Dr
- 4.23AC Jm Dr
- 507 S Poplar St
- 693 Old Quitman Annex Rd
- 808 Laurel Ave
- 344 Quillie Jones Rd
- 15 Elk Ln
- 380 Quillie Jones Rd
- 30 Horse Ln
- 168 Quillie Jones Rd
- 144 Quillie Jones Rd
- 520 Quillie Jones Rd
- 201 Elk Ln
- 272 Elk Ln
- 272 Elk Ln
- 550 Quillie Jones Rd
- 2468 Antioch Rd
- 44 Quillie Jones Rd
- 568 Quillie Jones Rd
- 12 Quillie Jones Rd
- 2308 Antioch Rd
- 2800 Antioch Rd
- 271 Harrell Rd
- 271 Harrell Rd
- 696 Quillie Jones Rd