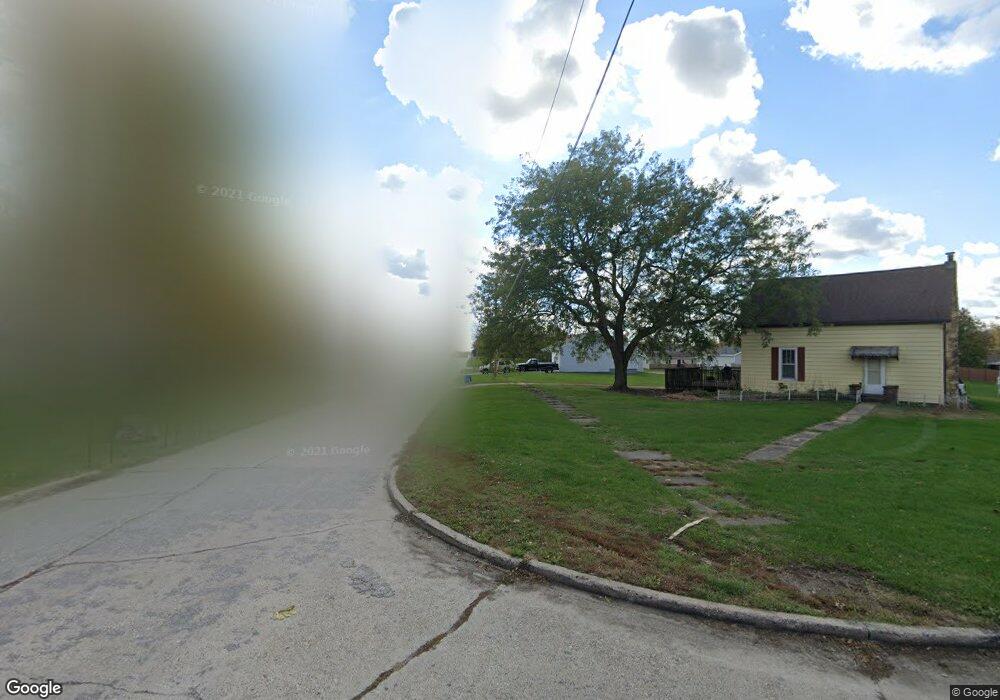
300 S 8th St Montezuma, IA 50171
Estimated Value: $83,000 - $158,000
2
Beds
1
Bath
1,088
Sq Ft
$120/Sq Ft
Est. Value
About This Home
This home is located at 300 S 8th St, Montezuma, IA 50171 and is currently estimated at $130,827, approximately $120 per square foot. 300 S 8th St is a home with nearby schools including Montezuma Elementary School and Montezuma Junior High School.
Ownership History
Date
Name
Owned For
Owner Type
Purchase Details
Closed on
Nov 18, 2024
Sold by
Bushong Michael Joe and Bushong Julie Lynn
Bought by
Ogan Matthew M and Ogan Melissa L
Current Estimated Value
Home Financials for this Owner
Home Financials are based on the most recent Mortgage that was taken out on this home.
Original Mortgage
$75,071
Outstanding Balance
$74,351
Interest Rate
6.32%
Mortgage Type
New Conventional
Estimated Equity
$56,476
Purchase Details
Closed on
Oct 1, 2004
Sold by
Bushong Michael J and Bushong Mcihael Joe
Bought by
Breniman John Edward
Create a Home Valuation Report for This Property
The Home Valuation Report is an in-depth analysis detailing your home's value as well as a comparison with similar homes in the area
Home Values in the Area
Average Home Value in this Area
Purchase History
| Date | Buyer | Sale Price | Title Company |
|---|---|---|---|
| Ogan Matthew M | $75,000 | None Listed On Document | |
| Ogan Matthew M | $75,000 | None Listed On Document | |
| Breniman John Edward | $2,500 | None Available |
Source: Public Records
Mortgage History
| Date | Status | Borrower | Loan Amount |
|---|---|---|---|
| Open | Ogan Matthew M | $75,071 | |
| Closed | Ogan Matthew M | $75,071 |
Source: Public Records
Tax History Compared to Growth
Tax History
| Year | Tax Paid | Tax Assessment Tax Assessment Total Assessment is a certain percentage of the fair market value that is determined by local assessors to be the total taxable value of land and additions on the property. | Land | Improvement |
|---|---|---|---|---|
| 2025 | $1,382 | $94,510 | $26,000 | $68,510 |
| 2024 | $1,462 | $94,290 | $23,110 | $71,180 |
| 2023 | $1,424 | $94,290 | $23,110 | $71,180 |
| 2022 | $1,392 | $76,010 | $18,380 | $57,630 |
| 2021 | $1,392 | $71,710 | $17,340 | $54,370 |
| 2020 | $1,348 | $71,710 | $17,340 | $54,370 |
| 2019 | $1,388 | $71,290 | $17,340 | $53,950 |
| 2018 | $1,370 | $71,290 | $17,340 | $53,950 |
| 2017 | $1,318 | $71,290 | $17,340 | $53,950 |
| 2016 | $1,196 | $71,290 | $17,340 | $53,950 |
| 2015 | -- | $71,290 | $17,340 | $53,950 |
| 2014 | -- | $71,290 | $17,340 | $53,950 |
Source: Public Records
Map
Nearby Homes