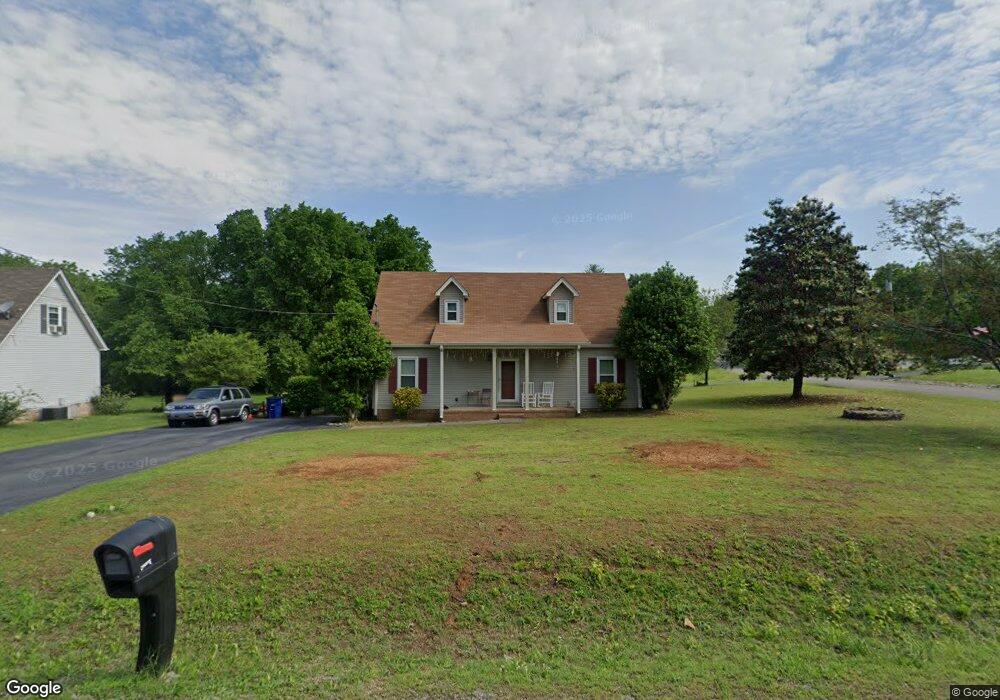
300 Southview Dr Shelbyville, TN 37160
Estimated Value: $250,653 - $315,000
--
Bed
2
Baths
1,536
Sq Ft
$194/Sq Ft
Est. Value
About This Home
This home is located at 300 Southview Dr, Shelbyville, TN 37160 and is currently estimated at $298,413, approximately $194 per square foot. 300 Southview Dr is a home located in Bedford County with nearby schools including South Side Elementary School, Harris Middle School, and Christian Chapel Academy.
Ownership History
Date
Name
Owned For
Owner Type
Purchase Details
Closed on
Jun 7, 1999
Sold by
Barnes Fred C
Bought by
Olivarez Robert and Olivarez Linda
Current Estimated Value
Purchase Details
Closed on
Sep 24, 1994
Bought by
Barnes Fred C and Barnes Teresa R
Purchase Details
Closed on
Apr 7, 1994
Bought by
Stiles Richard F
Purchase Details
Closed on
Feb 5, 1993
Bought by
Parker Bobby Lee
Purchase Details
Closed on
Jan 28, 1991
Bought by
Gambill Gale
Purchase Details
Closed on
Oct 9, 1990
Bought by
First Fed Savings Bank
Purchase Details
Closed on
Nov 10, 1989
Bought by
Peels John L and Annie Mai
Purchase Details
Closed on
Dec 9, 1986
Bought by
Peels John L and Annie Mai
Create a Home Valuation Report for This Property
The Home Valuation Report is an in-depth analysis detailing your home's value as well as a comparison with similar homes in the area
Home Values in the Area
Average Home Value in this Area
Purchase History
| Date | Buyer | Sale Price | Title Company |
|---|---|---|---|
| Olivarez Robert | $87,700 | -- | |
| Barnes Fred C | $59,400 | -- | |
| Stiles Richard F | $42,000 | -- | |
| Parker Bobby Lee | $32,000 | -- | |
| Gambill Gale | -- | -- | |
| First Fed Savings Bank | -- | -- | |
| Peels John L | -- | -- | |
| Peels John L | -- | -- |
Source: Public Records
Tax History Compared to Growth
Tax History
| Year | Tax Paid | Tax Assessment Tax Assessment Total Assessment is a certain percentage of the fair market value that is determined by local assessors to be the total taxable value of land and additions on the property. | Land | Improvement |
|---|---|---|---|---|
| 2025 | -- | $40,325 | $0 | $0 |
| 2024 | -- | $40,325 | $10,250 | $30,075 |
| 2023 | $1,535 | $40,325 | $10,250 | $30,075 |
| 2022 | $1,579 | $40,325 | $10,250 | $30,075 |
| 2021 | $1,433 | $40,325 | $10,250 | $30,075 |
| 2020 | $1,082 | $40,325 | $10,250 | $30,075 |
| 2019 | $1,082 | $24,425 | $5,250 | $19,175 |
| 2018 | $1,057 | $24,425 | $5,250 | $19,175 |
| 2017 | $1,057 | $24,425 | $5,250 | $19,175 |
| 2016 | $1,048 | $24,425 | $5,250 | $19,175 |
| 2015 | $1,048 | $24,425 | $5,250 | $19,175 |
| 2014 | $808 | $20,604 | $0 | $0 |
Source: Public Records
Map
Nearby Homes