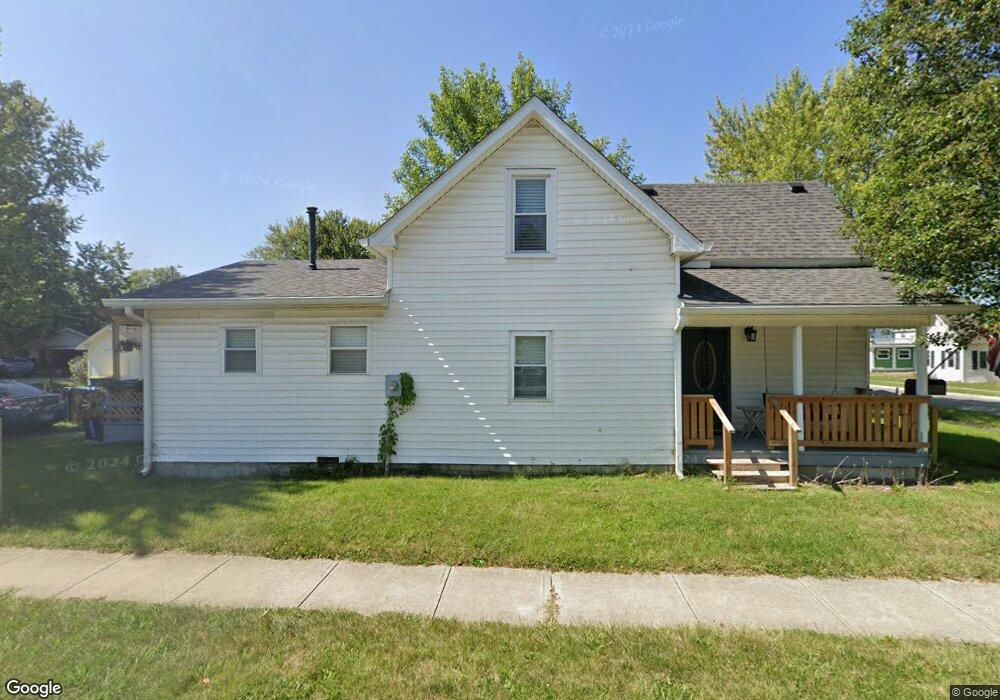
300 W 2nd St Sheridan, IN 46069
Estimated Value: $172,000 - $209,659
2
Beds
1
Bath
1,166
Sq Ft
$163/Sq Ft
Est. Value
About This Home
This home is located at 300 W 2nd St, Sheridan, IN 46069 and is currently estimated at $190,220, approximately $163 per square foot. 300 W 2nd St is a home located in Hamilton County with nearby schools including Sheridan Elementary School, Sheridan Middle School, and Sheridan High School.
Ownership History
Date
Name
Owned For
Owner Type
Purchase Details
Closed on
May 30, 2025
Sold by
Vanwinkle Alexander James
Bought by
Kilgore Robert C and Kilgore Alexandria P
Current Estimated Value
Home Financials for this Owner
Home Financials are based on the most recent Mortgage that was taken out on this home.
Original Mortgage
$174,503
Outstanding Balance
$174,057
Interest Rate
6.83%
Mortgage Type
New Conventional
Estimated Equity
$16,163
Purchase Details
Closed on
Jan 12, 2021
Sold by
Carter Joshua Morgan and Godby Betsy Leigh
Bought by
Vanwinkle Alexander James
Home Financials for this Owner
Home Financials are based on the most recent Mortgage that was taken out on this home.
Original Mortgage
$121,250
Interest Rate
2.67%
Mortgage Type
New Conventional
Purchase Details
Closed on
Mar 18, 2014
Sold by
Caldwell Irene and Caldwell Irene R
Bought by
Godby Betsy Leigh and Carter Joshua Morgan
Home Financials for this Owner
Home Financials are based on the most recent Mortgage that was taken out on this home.
Original Mortgage
$75,000
Interest Rate
4.29%
Mortgage Type
New Conventional
Create a Home Valuation Report for This Property
The Home Valuation Report is an in-depth analysis detailing your home's value as well as a comparison with similar homes in the area
Home Values in the Area
Average Home Value in this Area
Purchase History
| Date | Buyer | Sale Price | Title Company |
|---|---|---|---|
| Kilgore Robert C | -- | Fidelity National Title | |
| Vanwinkle Alexander James | -- | Chicago Title Company Llc | |
| Godby Betsy Leigh | -- | None Available |
Source: Public Records
Mortgage History
| Date | Status | Borrower | Loan Amount |
|---|---|---|---|
| Open | Kilgore Robert C | $174,503 | |
| Previous Owner | Vanwinkle Alexander James | $121,250 | |
| Previous Owner | Godby Betsy Leigh | $75,000 |
Source: Public Records
Tax History Compared to Growth
Tax History
| Year | Tax Paid | Tax Assessment Tax Assessment Total Assessment is a certain percentage of the fair market value that is determined by local assessors to be the total taxable value of land and additions on the property. | Land | Improvement |
|---|---|---|---|---|
| 2024 | $1,637 | $152,300 | $45,100 | $107,200 |
| 2023 | $1,662 | $148,600 | $45,100 | $103,500 |
| 2022 | $1,460 | $137,700 | $45,100 | $92,600 |
| 2021 | $1,460 | $127,400 | $45,100 | $82,300 |
| 2020 | $1,422 | $124,100 | $45,100 | $79,000 |
| 2019 | $1,302 | $113,800 | $18,800 | $95,000 |
| 2018 | $1,221 | $106,800 | $18,800 | $88,000 |
| 2017 | $1,068 | $97,900 | $18,800 | $79,100 |
| 2016 | $1,025 | $97,900 | $18,800 | $79,100 |
| 2014 | $988 | $93,400 | $31,900 | $61,500 |
| 2013 | $988 | $90,100 | $32,000 | $58,100 |
Source: Public Records
Map
Nearby Homes
- 402 E 2nd St
- 400 S Georgia St
- 514 E 2nd St
- 103 S Hudson St
- 903&905 S Georgia St
- 390 W State Road 38
- 600 S Georgia St
- 405 W 3rd St
- 308 E 8th St
- Harmony Plan at Centre Place
- Stamford Plan at Centre Place
- Henley Plan at Centre Place
- Chatham Plan at Centre Place
- Holcombe Plan at Centre Place
- Aldridge Plan at Centre Place
- 707 S Hamilton Ave
- 414 Elm Ave
- 3310 Godby Dr
- 3357 Godby Dr
- 3310 Godby St