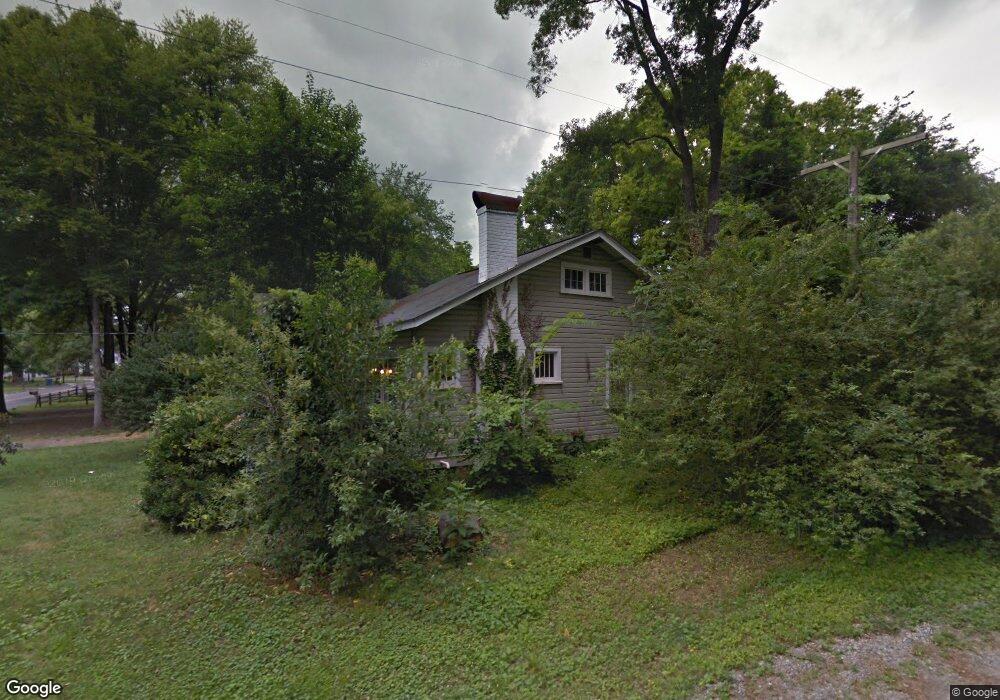
300 W Carver St Durham, NC 27704
Weaver NeighborhoodEstimated Value: $285,000 - $317,277
3
Beds
1
Bath
1,120
Sq Ft
$269/Sq Ft
Est. Value
About This Home
This home is located at 300 W Carver St, Durham, NC 27704 and is currently estimated at $301,319, approximately $269 per square foot. 300 W Carver St is a home located in Durham County with nearby schools including Holt Elementary, George L Carrington Middle, and Northern High School.
Ownership History
Date
Name
Owned For
Owner Type
Purchase Details
Closed on
Feb 27, 2025
Sold by
Keener Cynthia Jean
Bought by
Keener Dustin Lynn
Current Estimated Value
Purchase Details
Closed on
Aug 1, 2017
Sold by
Parvata Srini R and Patvata Srini R
Bought by
Durham Housing Center Llc
Purchase Details
Closed on
May 27, 2016
Sold by
Bowers V Edith
Bought by
Keener Dustin Lynn and Keener Cynthia Jean
Purchase Details
Closed on
Jul 11, 2007
Sold by
Carothers Joshua T and Carothers Jessica U
Bought by
Bowens Edith and Owen Robert W
Home Financials for this Owner
Home Financials are based on the most recent Mortgage that was taken out on this home.
Original Mortgage
$136,500
Interest Rate
6.37%
Purchase Details
Closed on
Jun 24, 2002
Sold by
Suitt Bruce Douglas and Suitt Karol Combs
Bought by
Carothers Joshua T and Carothers Jessica U
Home Financials for this Owner
Home Financials are based on the most recent Mortgage that was taken out on this home.
Original Mortgage
$113,000
Interest Rate
5.25%
Create a Home Valuation Report for This Property
The Home Valuation Report is an in-depth analysis detailing your home's value as well as a comparison with similar homes in the area
Home Values in the Area
Average Home Value in this Area
Purchase History
| Date | Buyer | Sale Price | Title Company |
|---|---|---|---|
| Keener Dustin Lynn | -- | None Listed On Document | |
| Keener Dustin Lynn | -- | None Listed On Document | |
| Durham Housing Center Llc | -- | None Available | |
| Keener Dustin Lynn | $139,000 | -- | |
| Bowens Edith | $136,500 | None Available | |
| Carothers Joshua T | $113,000 | -- |
Source: Public Records
Mortgage History
| Date | Status | Borrower | Loan Amount |
|---|---|---|---|
| Previous Owner | Bowens Edith | $136,500 | |
| Previous Owner | Carothers Joshua T | $113,000 |
Source: Public Records
Tax History Compared to Growth
Tax History
| Year | Tax Paid | Tax Assessment Tax Assessment Total Assessment is a certain percentage of the fair market value that is determined by local assessors to be the total taxable value of land and additions on the property. | Land | Improvement |
|---|---|---|---|---|
| 2025 | $2,264 | $340,001 | $147,600 | $192,401 |
| 2024 | $2,264 | $162,338 | $33,825 | $128,513 |
| 2023 | $2,126 | $162,337 | $33,825 | $128,512 |
| 2022 | $2,054 | $160,456 | $33,825 | $126,631 |
| 2021 | $2,044 | $160,456 | $33,825 | $126,631 |
| 2020 | $1,996 | $160,456 | $33,825 | $126,631 |
| 2019 | $1,790 | $143,907 | $33,825 | $110,082 |
| 2018 | $1,871 | $137,937 | $27,675 | $110,262 |
| 2017 | $1,857 | $137,937 | $27,675 | $110,262 |
| 2016 | $1,795 | $137,937 | $27,675 | $110,262 |
| 2015 | $1,386 | $100,123 | $18,321 | $81,802 |
| 2014 | $1,386 | $100,123 | $18,321 | $81,802 |
Source: Public Records
Map
Nearby Homes
- 415 W Carver St
- 2821 Broad St
- 711 W Carver St
- 2710 Broad St
- 2705 Broad St
- 2721 Shaftsbury St
- 3521 Duke Homestead Rd
- 505 Stratton Way
- 3256 Cascade Ln
- 3606 Meriwether Dr
- 158 Presidents Dr
- 4114 Sudbury Rd
- 13 Patriot Cir
- 12 Patriot Cir
- 2105 W Carver St
- 2503 Lednum St
- 27 Stonewall Way
- 14 Stone Village Ct
- 213 Teel Dr
- 1214 W Murray Ave
- 302 W Carver St
- 302 W Carver St
- 216 W Carver St
- 3853 Crabtree Ave
- 306 W Carver St
- 214 W Carver St
- 308 W Carver St
- 3857 Crabtree Ave
- 212 W Carver St
- 301 Newsom St
- 305 Newsom St
- 215 Newsom St
- 215 W Carver St
- 303 W Carver St
- 213 Newsom St
- 210 W Carver St
- 210 & 208 W Carver St
- 305 W Carver St
- 307 W Carver St
- 307 Newsom St