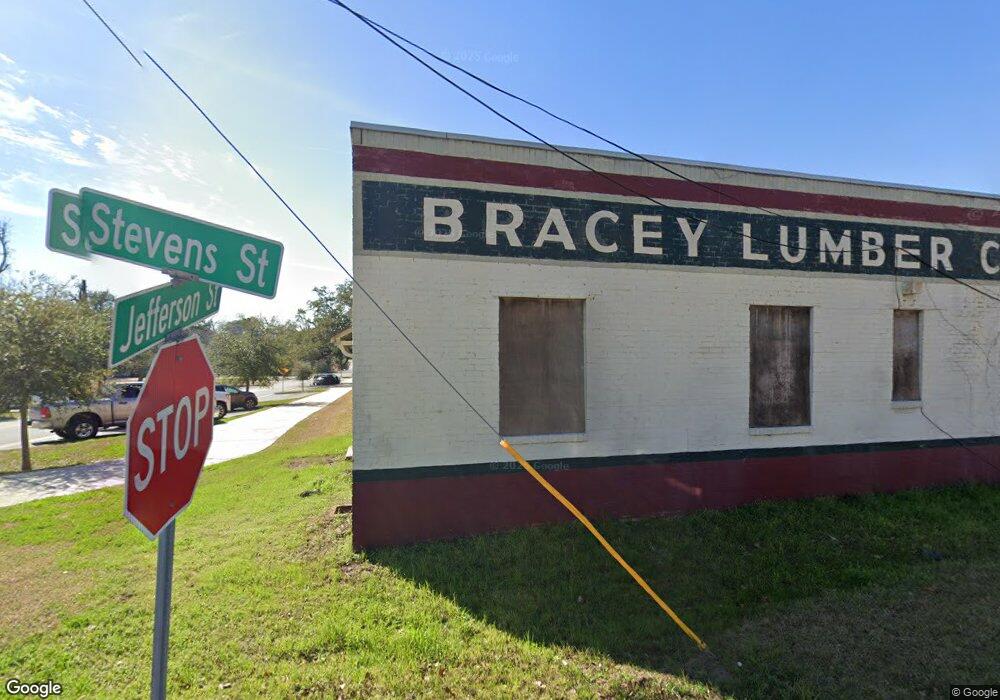
300 W Jefferson St Thomasville, GA 31792
Estimated Value: $1,000,533
--
Bed
--
Bath
17,300
Sq Ft
$58/Sq Ft
Est. Value
About This Home
This home is located at 300 W Jefferson St, Thomasville, GA 31792 and is currently estimated at $1,000,533, approximately $57 per square foot. 300 W Jefferson St is a home located in Thomas County with nearby schools including Thomasville High School, Thomasville Christian School, and World of Truth Christian Academy.
Ownership History
Date
Name
Owned For
Owner Type
Purchase Details
Closed on
Oct 1, 2024
Sold by
Bracey Square Llc
Bought by
Idaho Asset Management Trust and Isaacs K Gregory Tr
Current Estimated Value
Purchase Details
Closed on
Nov 17, 2020
Sold by
Ovanessian Takuhi
Bought by
Bracey Square Llc
Purchase Details
Closed on
Sep 30, 2020
Sold by
Antikythera Holding Co Llc
Bought by
Ovanessian Takuhi
Purchase Details
Closed on
Jun 23, 2017
Bought by
Antikythera Holding Co Llc
Purchase Details
Closed on
Sep 27, 2016
Sold by
Talon Land Holdings Llc
Bought by
Synovus Bank
Purchase Details
Closed on
Jun 8, 2009
Sold by
Bracey John A
Bought by
Talon Land Holdings Llc
Purchase Details
Closed on
Oct 7, 2008
Sold by
Bracey John A
Bought by
Talon Properties Llc
Purchase Details
Closed on
Dec 29, 1994
Bought by
Bracey John A
Create a Home Valuation Report for This Property
The Home Valuation Report is an in-depth analysis detailing your home's value as well as a comparison with similar homes in the area
Home Values in the Area
Average Home Value in this Area
Purchase History
| Date | Buyer | Sale Price | Title Company |
|---|---|---|---|
| Idaho Asset Management Trust | $980,000 | -- | |
| Bracey Square Llc | -- | -- | |
| Ovanessian Takuhi | $700,000 | -- | |
| Antikythera Holding Co Llc | $250,000 | -- | |
| Synovus Bank | $470,000 | -- | |
| Talon Land Holdings Llc | -- | -- | |
| Talon Properties Llc | -- | -- | |
| Bracey John A | -- | -- |
Source: Public Records
Tax History Compared to Growth
Tax History
| Year | Tax Paid | Tax Assessment Tax Assessment Total Assessment is a certain percentage of the fair market value that is determined by local assessors to be the total taxable value of land and additions on the property. | Land | Improvement |
|---|---|---|---|---|
| 2024 | $3,231 | $134,066 | $71,638 | $62,428 |
| 2023 | $3,094 | $125,048 | $71,638 | $53,410 |
| 2022 | $1,033 | $110,295 | $20,766 | $89,529 |
| 2021 | $1,106 | $107,325 | $20,766 | $86,559 |
| 2020 | $1,100 | $104,379 | $20,766 | $83,613 |
| 2019 | $1,110 | $104,379 | $20,766 | $83,613 |
| 2018 | $1,074 | $105,069 | $20,766 | $84,303 |
| 2017 | $0 | $110,031 | $20,766 | $89,265 |
| 2016 | $1,390 | $126,554 | $20,766 | $105,788 |
| 2015 | $1,412 | $127,320 | $20,766 | $106,554 |
| 2014 | $1,427 | $127,320 | $20,766 | $106,554 |
| 2013 | -- | $127,646 | $20,765 | $106,880 |
Source: Public Records
Map
Nearby Homes
- 110 W Jackson St Unit PO-1
- 501 N Oak St
- 447 Timber Ridge Drive (Lot 5a and 5b) Unit 5A5B
- 213 Bloomfield Lakes Dr
- 00 U S Highway 319 N Sanford Rd
- 12.7ACR U S Highway 319
- 415 N Crawford St
- 447 Timber Ridge Dr
- United States
- 222 Victoria Place
- 415 Fletcher St
- 515 Pine St
- 1101 N Crawford St
- 526 N Crawford St
- 202 Lester St
- 204 Lester St
- 228 Gordon Ave
- 314 Bartow St
- 111 Magnolia St
- 207 Mckinley St
- 125 N Stevens St
- 301 N Stevens St
- 306 W Washington St
- 320 W Washington St
- 105 N Stevens St
- 305 N Stevens St
- 219 Oak St
- 322 W Washington St
- 307 N Stevens St
- 127 Oak St
- 407 W Jefferson St
- 314 Oak St
- 127 Oak St
- 312 Oak St
- 311 N Stevens St
- 236 W Jackson St
- 315 N Stevens St
- 232 W Jackson St
- 106 Oak St
- 316 Oak St