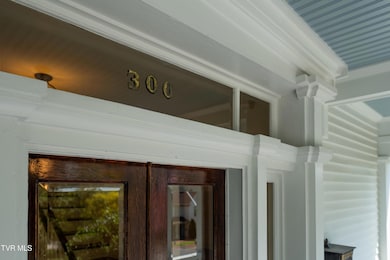
300 W Main St Jonesborough, TN 37659
Estimated payment $7,503/month
Highlights
- Garage Apartment
- Colonial Architecture
- Whirlpool Bathtub
- 0.8 Acre Lot
- Wood Flooring
- 3-minute walk to Depot Street Park
About This Home
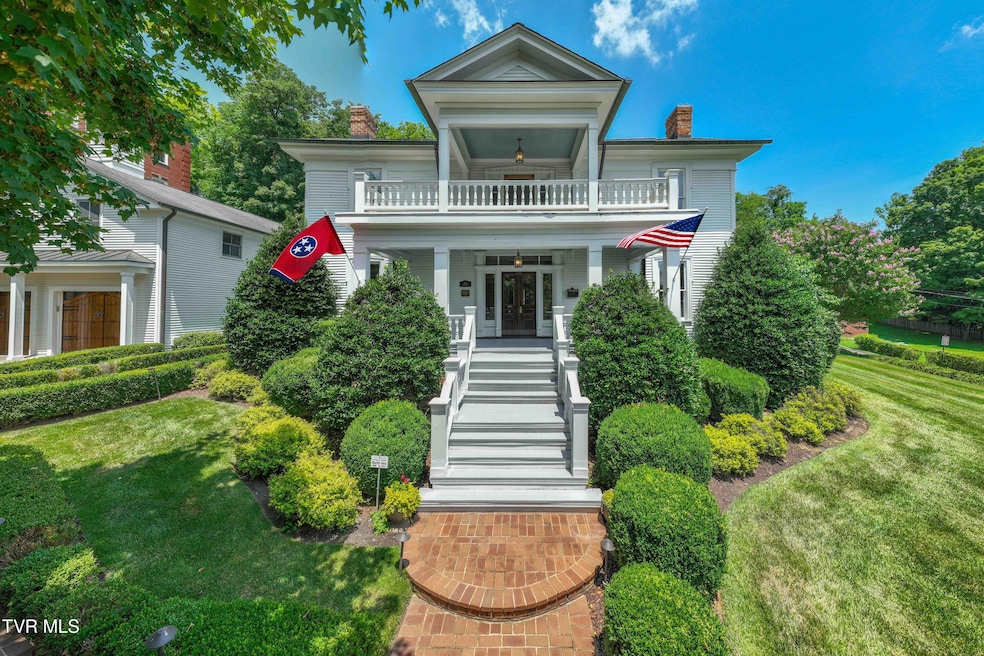
Timeless Charm Meets Modern Luxury in the Heart of Historic Jonesborough
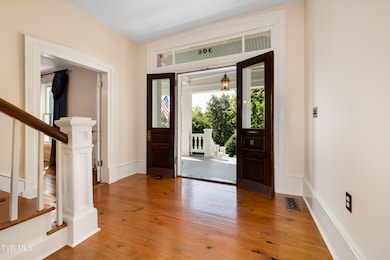
Located at the heart of Jonesborough, Tennessee's oldest town, this extraordinary 1860s home captures the essence of Tennessee and America's rich history. Offering over 4,000 sq ft of meticulously restored living space, 4 bedrooms, 4.5 baths, and a 3/4-acre corner lot perched just high enough to enjoy sweeping views of Main Street, this property is the picture of small-town Americana. Just steps from theaters, cafes, shops and the National Storytelling Center, it's the kind of home that sparks the imagination—a true Main Street dream.
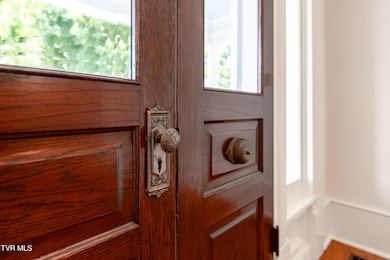
Every inch has been thoughtfully restored from the ground up, preserving original hardwood floors, moldings, mantles, staircase, handrails, windows, and siding—while seamlessly integrating modern upgrades like thermopane windows, a whole-home generator, Rheem EcoNet HVAC, central vacuum(s), and top-tier construction.
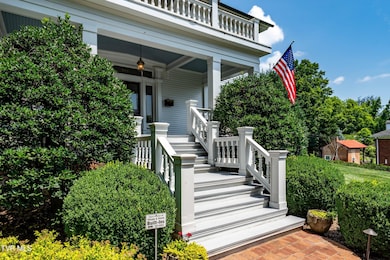
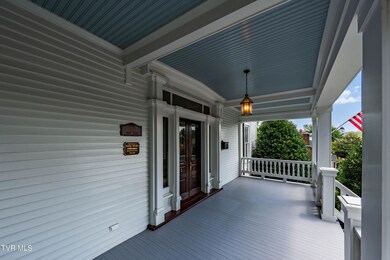
Enjoy over 1,100 sqft on four inviting porches: a sleeping porch with views of the historic courthouse, screened porch off the kitchen, a classic rocking chair front portico, and a serene garden veranda.
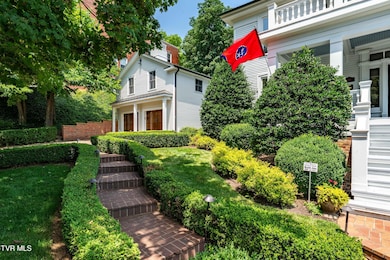
Over 2,000 sqft of Terraced hardscape and patios stretch across the estate, and exquisitely maintained landscaping creates an outdoor sanctuary, that can only be created with TIME and a CARING hand, complete with landscape lighting, sprinkler system, Bearboard tongue-and-groove decking, and copper gutters. Two charming outbuildings—a smokehouse-turned-yard shed and potting shed—add to the historic character.
A detached carriage house includes an 850 sq ft garage with a private suite above—an ideal space for hosting guests or operating a Bed & Breakfast, making this estate a true showcase of Southern hospitality.
Only a handful of historic properties exist where you can sit on your front porch and watch the charm on a HISTORIC Main Street of one of America's oldest towns.
Buyer/Buyer's agent to verify all MLS info
Listing Agent
Berkshire Hathaway Greg Cox Real Estate License #308589 Listed on: 07/25/2025

Home Details
Home Type
- Single Family
Est. Annual Taxes
- $3,066
Year Built
- Built in 1864 | Remodeled
Lot Details
- 0.8 Acre Lot
- Lot Dimensions are 250 x 125
- Landscaped
- Sprinkler System
- Cleared Lot
- Garden
- Historic Home
- Property is in good condition
Parking
- 3 Car Garage
- Garage Apartment
- Garage Door Opener
- Driveway
Home Design
- Colonial Architecture
- Traditional Architecture
- Shingle Roof
- Wood Siding
Interior Spaces
- 4,050 Sq Ft Home
- 2-Story Property
- Central Vacuum
- 4 Fireplaces
- Double Pane Windows
- Insulated Windows
- Entrance Foyer
- Screened Porch
- Wood Flooring
- Crawl Space
Kitchen
- Eat-In Kitchen
- Gas Range
- Dishwasher
- Kitchen Island
- Solid Surface Countertops
- Utility Sink
- Disposal
Bedrooms and Bathrooms
- 4 Bedrooms
- Walk-In Closet
- Whirlpool Bathtub
Laundry
- Laundry Room
- Washer and Electric Dryer Hookup
Home Security
- Security System Owned
- Fire and Smoke Detector
Outdoor Features
- Balcony
- Patio
- Terrace
- Shed
- Breezeway
Schools
- Jonesborough Elementary And Middle School
- David Crockett High School
Utilities
- Central Heating and Cooling System
- Heating System Uses Natural Gas
- Heat Pump System
- Power Generator
Community Details
- No Home Owners Association
Listing and Financial Details
- Assessor Parcel Number 060a C 011.00
Map
Home Values in the Area
Average Home Value in this Area
Tax History
| Year | Tax Paid | Tax Assessment Tax Assessment Total Assessment is a certain percentage of the fair market value that is determined by local assessors to be the total taxable value of land and additions on the property. | Land | Improvement |
|---|---|---|---|---|
| 2024 | $3,066 | $179,325 | $18,425 | $160,900 |
| 2022 | $2,509 | $116,700 | $21,675 | $95,025 |
| 2021 | $2,509 | $116,700 | $21,675 | $95,025 |
| 2020 | $3,909 | $116,700 | $21,675 | $95,025 |
| 2019 | $2,885 | $116,700 | $21,675 | $95,025 |
| 2018 | $4,062 | $110,075 | $20,400 | $89,675 |
| 2017 | $4,023 | $109,025 | $20,400 | $88,625 |
| 2016 | $4,023 | $109,025 | $20,400 | $88,625 |
| 2015 | $3,587 | $109,025 | $20,400 | $88,625 |
| 2014 | $3,587 | $109,025 | $20,400 | $88,625 |
Property History
| Date | Event | Price | List to Sale | Price per Sq Ft |
|---|---|---|---|---|
| 10/13/2025 10/13/25 | Pending | -- | -- | -- |
| 10/03/2025 10/03/25 | Price Changed | $1,375,000 | -3.5% | $340 / Sq Ft |
| 07/25/2025 07/25/25 | For Sale | $1,425,000 | -- | $352 / Sq Ft |
Purchase History
| Date | Type | Sale Price | Title Company |
|---|---|---|---|
| Quit Claim Deed | -- | None Listed On Document | |
| Warranty Deed | $65,000 | None Available | |
| Deed | $409,000 | -- | |
| Warranty Deed | $48,500 | -- |
Mortgage History
| Date | Status | Loan Amount | Loan Type |
|---|---|---|---|
| Previous Owner | $327,200 | No Value Available |
Source: Tennessee/Virginia Regional MLS
MLS Number: 9983620
APN: 060A-C-011.00
Disclaimer: Certain information contained herein is derived from information provided by parties other than Homes.com. All information provided is deemed reliable, but is not guaranteed to be accurate and should be independently verified.
![]() IDX information is provided exclusively for personal, non-commercial use, and may not be used for any purpose other than to identify prospective properties consumers may be interested in purchasing. Some or all of the listings displayed may not belong to the firm whose website is being visited
IDX information is provided exclusively for personal, non-commercial use, and may not be used for any purpose other than to identify prospective properties consumers may be interested in purchasing. Some or all of the listings displayed may not belong to the firm whose website is being visited
Listing information is deemed reliable, but not guaranteed.
- 305 W Main St
- 109 E Main St Unit Ste 301
- 203 S Cherokee St
- 140 New St
- 102 Willow Creek Ln Unit B
- 400 S Cherokee St
- 616 W Main St
- 204 Maple Dr
- 126 Boone St
- 318 English Ivy Trail
- 501 Smith Ln
- 329 English Ivy Trail
- 808 Allison Dr
- Lot 45 English Ivy Trail
- Lot 44 English Ivy Trail
- Lot 49 English Ivy Trail
- 315 Old Franklin Place
- 140 W Hills Dr
- 440 English Ivy Trail
- 0 Allison Dr