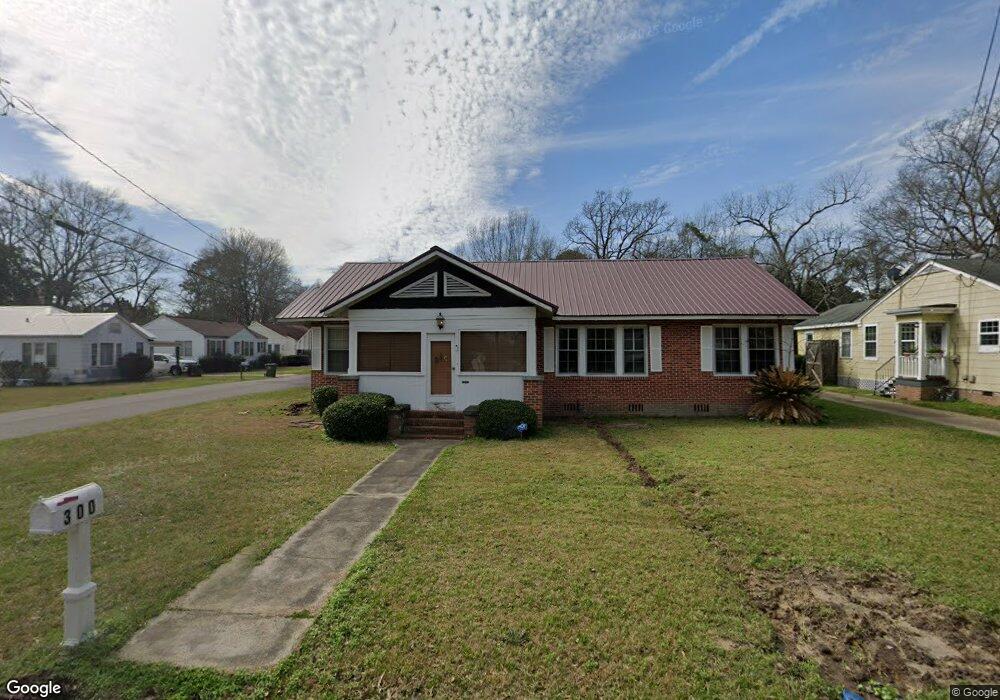
300 Xavier St Hattiesburg, MS 39401
North Main Historic NeighborhoodEstimated Value: $121,000 - $232,000
2
Beds
1
Bath
1,739
Sq Ft
$97/Sq Ft
Est. Value
About This Home
This home is located at 300 Xavier St, Hattiesburg, MS 39401 and is currently estimated at $168,583, approximately $96 per square foot. 300 Xavier St is a home located in Forrest County with nearby schools including Hawkins Elementary SMART School, N.R. Burger Middle School, and Hattiesburg High School.
Ownership History
Date
Name
Owned For
Owner Type
Purchase Details
Closed on
Feb 13, 2023
Sold by
Mickels Peter L
Bought by
Mcnair Marlena
Current Estimated Value
Purchase Details
Closed on
Aug 29, 2019
Sold by
Booth Yvette S and Booth James
Bought by
Mickels Peter L
Home Financials for this Owner
Home Financials are based on the most recent Mortgage that was taken out on this home.
Original Mortgage
$68,640
Interest Rate
3.7%
Mortgage Type
Unknown
Create a Home Valuation Report for This Property
The Home Valuation Report is an in-depth analysis detailing your home's value as well as a comparison with similar homes in the area
Home Values in the Area
Average Home Value in this Area
Purchase History
| Date | Buyer | Sale Price | Title Company |
|---|---|---|---|
| Mcnair Marlena | -- | -- | |
| Mcnair Marlena | -- | None Listed On Document | |
| Mickels Peter L | -- | -- |
Source: Public Records
Mortgage History
| Date | Status | Borrower | Loan Amount |
|---|---|---|---|
| Previous Owner | Mickels Peter L | $68,640 |
Source: Public Records
Tax History Compared to Growth
Tax History
| Year | Tax Paid | Tax Assessment Tax Assessment Total Assessment is a certain percentage of the fair market value that is determined by local assessors to be the total taxable value of land and additions on the property. | Land | Improvement |
|---|---|---|---|---|
| 2024 | $2,047 | $11,109 | $0 | $0 |
| 2023 | $2,047 | $74,060 | $0 | $0 |
| 2022 | $997 | $7,406 | $0 | $0 |
| 2021 | $997 | $7,406 | $0 | $0 |
| 2020 | $997 | $7,185 | $0 | $0 |
| 2019 | $992 | $6,991 | $0 | $0 |
| 2018 | $997 | $6,991 | $0 | $0 |
| 2017 | $988 | $6,991 | $0 | $0 |
| 2016 | $910 | $6,505 | $0 | $0 |
| 2015 | $891 | $65,054 | $0 | $0 |
| 2014 | $865 | $6,505 | $0 | $0 |
Source: Public Records
Map
Nearby Homes