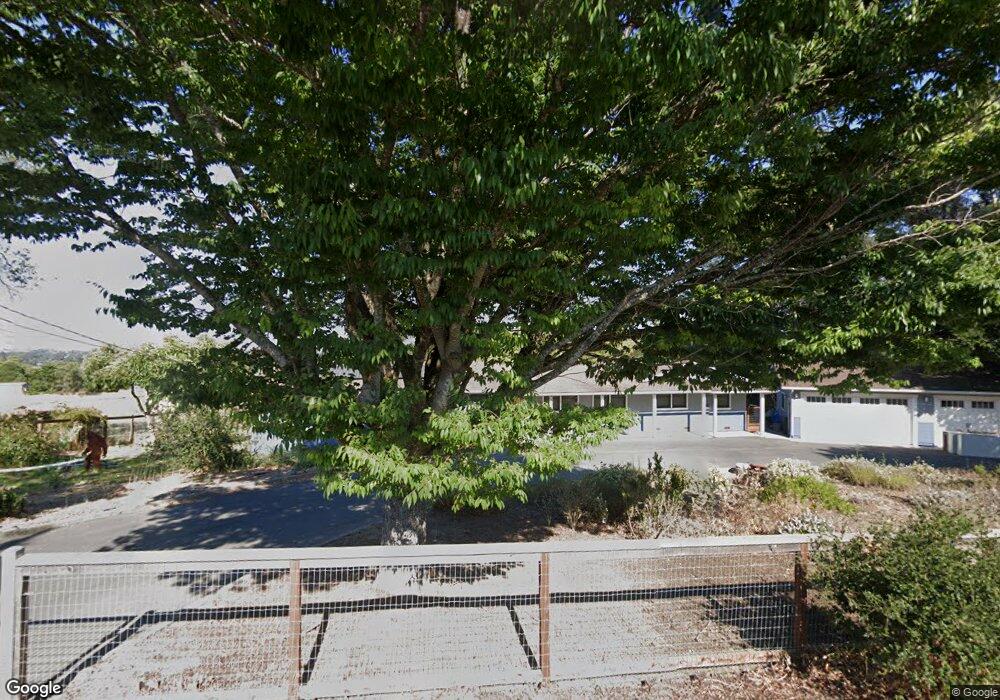
3000 Eastman Ln Petaluma, CA 94952
Estimated Value: $1,423,585 - $1,586,000
3
Beds
3
Baths
1,362
Sq Ft
$1,105/Sq Ft
Est. Value
About This Home
This home is located at 3000 Eastman Ln, Petaluma, CA 94952 and is currently estimated at $1,504,793, approximately $1,104 per square foot. 3000 Eastman Ln is a home located in Sonoma County with nearby schools including Wilson Elementary School, Petaluma Junior High School, and Petaluma High School.
Ownership History
Date
Name
Owned For
Owner Type
Purchase Details
Closed on
May 21, 2020
Sold by
Jebe David H and Jebe Brittany M
Bought by
Jebe David H and Jebe Brittany Michelle
Current Estimated Value
Purchase Details
Closed on
Oct 30, 2017
Sold by
Jebe David H and Jebe Brittany M
Bought by
Jebe David H and Jebe Brittany M
Home Financials for this Owner
Home Financials are based on the most recent Mortgage that was taken out on this home.
Original Mortgage
$115,000
Outstanding Balance
$96,314
Interest Rate
3.83%
Mortgage Type
Credit Line Revolving
Estimated Equity
$1,408,479
Purchase Details
Closed on
Apr 15, 2016
Sold by
Gallagher Elizabeth R
Bought by
Jebe David H and Rusell Brittany M
Home Financials for this Owner
Home Financials are based on the most recent Mortgage that was taken out on this home.
Original Mortgage
$520,000
Outstanding Balance
$413,108
Interest Rate
3.68%
Mortgage Type
New Conventional
Estimated Equity
$1,091,685
Purchase Details
Closed on
Aug 23, 2007
Sold by
Gallagher Elizabeth R
Bought by
Gallagher Elizabeth R
Create a Home Valuation Report for This Property
The Home Valuation Report is an in-depth analysis detailing your home's value as well as a comparison with similar homes in the area
Home Values in the Area
Average Home Value in this Area
Purchase History
| Date | Buyer | Sale Price | Title Company |
|---|---|---|---|
| Jebe David H | -- | None Available | |
| Jebe David H | -- | First American Title Company | |
| Jebe David H | $770,000 | Fidelity National Title Co | |
| Gallagher Elizabeth R | -- | None Available |
Source: Public Records
Mortgage History
| Date | Status | Borrower | Loan Amount |
|---|---|---|---|
| Open | Jebe David H | $115,000 | |
| Open | Jebe David H | $520,000 |
Source: Public Records
Tax History Compared to Growth
Tax History
| Year | Tax Paid | Tax Assessment Tax Assessment Total Assessment is a certain percentage of the fair market value that is determined by local assessors to be the total taxable value of land and additions on the property. | Land | Improvement |
|---|---|---|---|---|
| 2025 | $11,265 | $1,136,966 | $402,487 | $734,479 |
| 2024 | $11,265 | $1,017,774 | $394,596 | $623,178 |
| 2023 | $11,265 | $997,818 | $386,859 | $610,959 |
| 2022 | $10,792 | $978,254 | $379,274 | $598,980 |
| 2021 | $10,549 | $959,074 | $371,838 | $587,236 |
| 2020 | $10,630 | $949,241 | $368,026 | $581,215 |
| 2019 | $10,461 | $930,629 | $360,810 | $569,819 |
| 2018 | $9,143 | $801,108 | $353,736 | $447,372 |
| 2017 | $8,989 | $58,074 | $16,258 | $41,816 |
| 2016 | $789 | $56,937 | $15,940 | $40,997 |
| 2015 | $821 | $56,083 | $15,701 | $40,382 |
| 2014 | -- | $54,985 | $15,394 | $39,591 |
Source: Public Records
Map
Nearby Homes
- 1525 Eastman Ln
- 4335 Bodega Ave
- 4288 Bodega Ave
- 268 Eucalyptus Rd
- 39 Volkers Dr
- 3234 Skillman Ln
- 673 Lohrman Ln
- 1060 Lohrman Ln
- 3150 Skillman Ln
- 2590 Chileno Valley Rd
- 1105 West St
- 1375 Gossage Ave
- 509 Larch Dr
- 509 Rainsville Rd
- 12 Dorenfeld Ct
- 13 Fowler Ct
- 13 Dorenfeld Ct
- 513 Larch Dr
- 246 Edinburgh Ln
- 1 Kazen Way
- 3100 Eastman Ln
- 2999 Eastman Ln
- 3170 Eastman Ln
- 2920 Eastman Ln
- 3191 Eastman Ln
- 2995 Eastman Ln
- 3300 Eastman Ln
- 2870 Eastman Ln
- 3185 Eastman Ln
- 3211 Eastman Ln
- 3091 Eastman Ln
- 260 Goldman Ln
- 3301 Eastman Ln
- 222 Goldman Ln
- 2807 Eastman Ln
- 2805 Eastman Ln
- 3307 Eastman Ln
- 3190 Eastman Ln
- 2590 Eastman Ln
- 3330 Eastman Ln