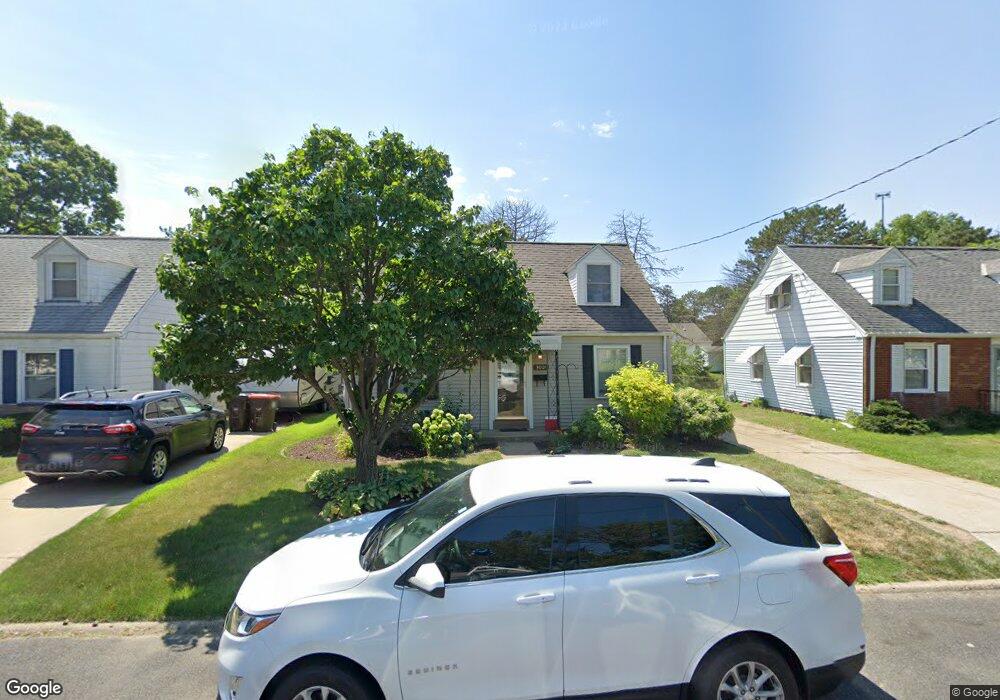
3001 N Saint Philomena Ct Peoria, IL 61604
West Bluff NeighborhoodEstimated Value: $104,452 - $125,000
2
Beds
1
Bath
1,092
Sq Ft
$108/Sq Ft
Est. Value
About This Home
This home is located at 3001 N Saint Philomena Ct, Peoria, IL 61604 and is currently estimated at $118,113, approximately $108 per square foot. 3001 N Saint Philomena Ct is a home located in Peoria County with nearby schools including Dr. C. T. Vivian Primary School, Sterling Middle School, and Peoria High School.
Ownership History
Date
Name
Owned For
Owner Type
Purchase Details
Closed on
Feb 22, 2019
Sold by
Downing Isaac S and Downing Rachel S
Bought by
Stevenson Prop Of Peoria Llc
Current Estimated Value
Purchase Details
Closed on
Feb 21, 2019
Sold by
Downing Isaac S and Downing Rachel S
Bought by
Stevenson Prop Of Peoria Llc
Purchase Details
Closed on
Jun 21, 2018
Sold by
Downing Isaac S and Downing Rachel S
Bought by
Son Steven and Son Melissa
Home Financials for this Owner
Home Financials are based on the most recent Mortgage that was taken out on this home.
Original Mortgage
$56,250
Interest Rate
4.5%
Mortgage Type
New Conventional
Purchase Details
Closed on
Mar 12, 2003
Bought by
Downing Isaac and Downing Rachel S
Create a Home Valuation Report for This Property
The Home Valuation Report is an in-depth analysis detailing your home's value as well as a comparison with similar homes in the area
Home Values in the Area
Average Home Value in this Area
Purchase History
| Date | Buyer | Sale Price | Title Company |
|---|---|---|---|
| Stevenson Prop Of Peoria Llc | -- | Attorney Only | |
| Stevenson Prop Of Peoria Llc | -- | Attorney Only | |
| Son Steven | $75,000 | None Listed On Document | |
| Downing Isaac | $73,000 | -- |
Source: Public Records
Mortgage History
| Date | Status | Borrower | Loan Amount |
|---|---|---|---|
| Previous Owner | Son Steven | $56,250 |
Source: Public Records
Tax History Compared to Growth
Tax History
| Year | Tax Paid | Tax Assessment Tax Assessment Total Assessment is a certain percentage of the fair market value that is determined by local assessors to be the total taxable value of land and additions on the property. | Land | Improvement |
|---|---|---|---|---|
| 2024 | $2,921 | $32,290 | $6,750 | $25,540 |
| 2023 | $2,787 | $29,620 | $6,190 | $23,430 |
| 2022 | $2,842 | $29,460 | $6,140 | $23,320 |
| 2021 | $2,790 | $28,060 | $5,850 | $22,210 |
| 2020 | $2,784 | $27,780 | $5,790 | $21,990 |
| 2019 | $2,824 | $28,350 | $5,910 | $22,440 |
| 2018 | $2,242 | $29,020 | $5,970 | $23,050 |
| 2017 | $2,247 | $29,310 | $6,030 | $23,280 |
| 2016 | $2,173 | $29,310 | $6,030 | $23,280 |
| 2015 | $2,126 | $28,730 | $5,910 | $22,820 |
| 2014 | $2,133 | $29,090 | $5,610 | $23,480 |
| 2013 | -- | $29,450 | $5,680 | $23,770 |
Source: Public Records
Map
Nearby Homes
- 2908 N Saint Philomena Ct
- 3026 N Parish Ave
- 1105 W Gilbert Ave
- 723 W Melbourne Ave
- 1017 W Willcox Ave
- 3007 N Sheridan Rd
- 720 W Corrington Ave
- 718 W Corrington Ave
- 3203 N Biltmore Ave
- 1013 W Hanssler Place
- 3121 N Isabell Ave
- 810 W Hanssler Place
- 604 W Forrest Hill Ave
- 2905 N University St
- 617 W Hanssler Place
- 609 W Hudson St
- 502 W Melbourne Ave
- 518 W Willcox Ave
- 807 W Mcclure Ave
- 1207 W Mcclure Ave
- 2931 N Saint Philomena Ct
- 3005 N Saint Philomena Ct
- 2929 N Saint Philomena Ct
- 2929 N St Philomena Ct
- 3007 N Saint Philomena Ct
- 3004 N St Philomena Ct
- 2930 N St Philomena Ct
- 3000 N Saint Philomena Ct
- 2925 N Saint Philomena Ct
- 2930 N St Philomena None
- 2930 N Saint Philomena Ct
- 3004 N Saint Philomena Ct
- 2926 N St Philomena Ct
- 2926 N Saint Philomena Ct
- 3006 N Saint Philomena Ct
- 3015 N St Philomena Ct
- 2921 N Saint Philomena Ct
- 3015 N Saint Philomena Ct
- 2924 N St Philomena Ct