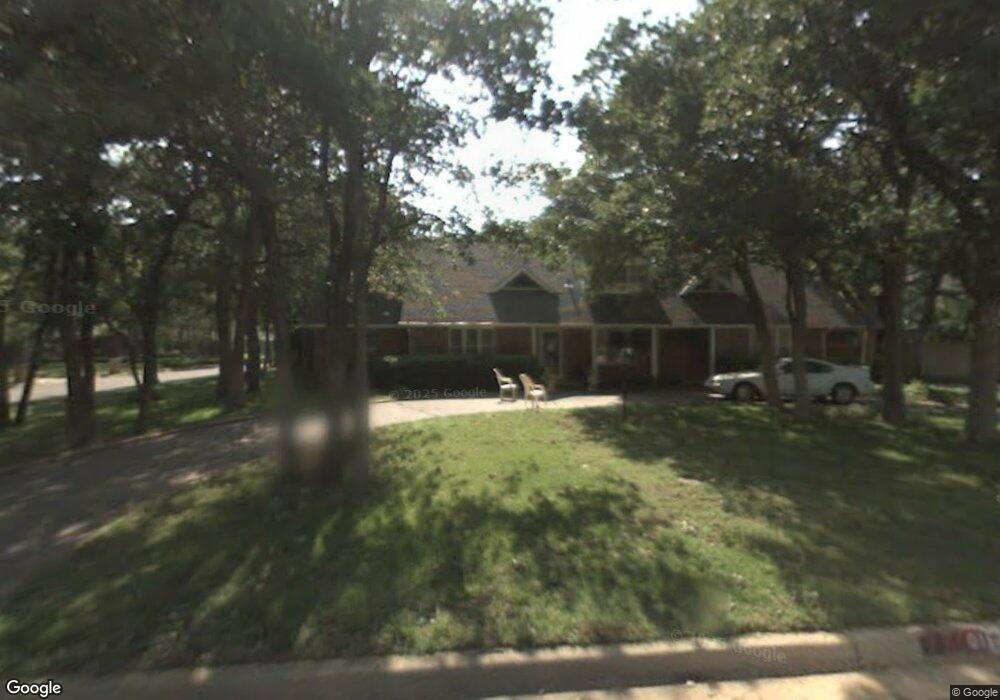
3001 Springdale Ln Duncan, OK 73533
Estimated Value: $302,397 - $361,000
4
Beds
4
Baths
3,366
Sq Ft
$98/Sq Ft
Est. Value
About This Home
This home is located at 3001 Springdale Ln, Duncan, OK 73533 and is currently estimated at $330,599, approximately $98 per square foot. 3001 Springdale Ln is a home located in Stephens County with nearby schools including Plato Elementary School, Duncan Middle School, and Duncan High School.
Ownership History
Date
Name
Owned For
Owner Type
Purchase Details
Closed on
Jul 17, 2020
Sold by
Johnson Edward A and Johnson Marlynn C
Bought by
Fincher Casey J
Current Estimated Value
Home Financials for this Owner
Home Financials are based on the most recent Mortgage that was taken out on this home.
Original Mortgage
$195,200
Outstanding Balance
$172,704
Interest Rate
3.1%
Mortgage Type
New Conventional
Estimated Equity
$157,895
Purchase Details
Closed on
Sep 30, 2015
Sold by
Powelson Ronald A and Powelson Leisha F
Bought by
Johnson Ii Edward A and Johnson Marylnn C
Home Financials for this Owner
Home Financials are based on the most recent Mortgage that was taken out on this home.
Original Mortgage
$235,161
Interest Rate
4.5%
Mortgage Type
FHA
Purchase Details
Closed on
Jun 3, 1994
Sold by
Richardson John Mark
Bought by
Powelson Ronald A and Powelson Leisha
Purchase Details
Closed on
Jun 15, 1990
Create a Home Valuation Report for This Property
The Home Valuation Report is an in-depth analysis detailing your home's value as well as a comparison with similar homes in the area
Home Values in the Area
Average Home Value in this Area
Purchase History
| Date | Buyer | Sale Price | Title Company |
|---|---|---|---|
| Fincher Casey J | $244,000 | First American Title | |
| Johnson Ii Edward A | $239,500 | None Available | |
| Powelson Ronald A | $130,000 | -- | |
| -- | $3,500 | -- |
Source: Public Records
Mortgage History
| Date | Status | Borrower | Loan Amount |
|---|---|---|---|
| Open | Fincher Casey J | $195,200 | |
| Previous Owner | Johnson Ii Edward A | $235,161 |
Source: Public Records
Tax History Compared to Growth
Tax History
| Year | Tax Paid | Tax Assessment Tax Assessment Total Assessment is a certain percentage of the fair market value that is determined by local assessors to be the total taxable value of land and additions on the property. | Land | Improvement |
|---|---|---|---|---|
| 2025 | $2,456 | $28,534 | $2,788 | $25,746 |
| 2024 | $2,456 | $28,837 | $2,788 | $26,049 |
| 2023 | $2,456 | $27,464 | $2,788 | $24,676 |
| 2022 | $2,333 | $27,442 | $2,788 | $24,654 |
| 2021 | $2,310 | $27,125 | $2,788 | $24,337 |
| 2020 | $2,226 | $26,778 | $2,788 | $23,990 |
| 2019 | $2,249 | $25,998 | $2,788 | $23,210 |
| 2018 | $2,342 | $26,302 | $2,788 | $23,514 |
| 2017 | $2,253 | $26,213 | $2,788 | $23,425 |
| 2016 | $2,241 | $26,363 | $2,788 | $23,575 |
| 2015 | $1,836 | $22,289 | $2,788 | $19,501 |
| 2014 | $1,836 | $22,289 | $2,788 | $19,501 |
Source: Public Records
Map
Nearby Homes
- 2814 2814 Springdale Ln
- 30 Canterbury Ln
- 28 Canterbury Ln
- 1706 1706 Foxboro
- 3005 W Foxboro
- 1705 Foxboro Dr
- 3990 N Ridgeview Dr
- 2901 2901 Timber Ridge
- 1314 Dr
- 1205 1205 Timbercreek Dr
- 3602 Woodknoll
- 3606 Woodknoll
- 2518 Wildwood Place
- 2702 2702 Wildwood Place
- 1927 High Meadow Dr
- 3412 Fox Hollow Rd
- 1102 1102 Bent Tree
- 1014 Oakview Dr
- 0 Twilight Beach Rd Unit 38527
- 1009 1009 Timbercreek Dr
- 3003 Springdale Ln
- 3002 Stagestand Rd
- 2026 Crestwood Ln
- 3002 Springdale Ln
- 3004 Stagestand Rd
- 2030 Crestwood Ln
- 3005 Springdale Ln
- 3005 Springdale Ln
- 3000 Springdale Ln
- 3004 Springdale Ln
- 2916 Stagestand Rd
- 2916 Springdale Ln
- 3006 Stagestand Rd
- 3006 3006 N Springdale Ln
- 2913 Springdale Ln
- 2909 Springdale Ct
- 3006 Springdale Ln
- 3011 Springdale Ln
- 2912 Springdale Ln
- 2912 Stagestand Rd