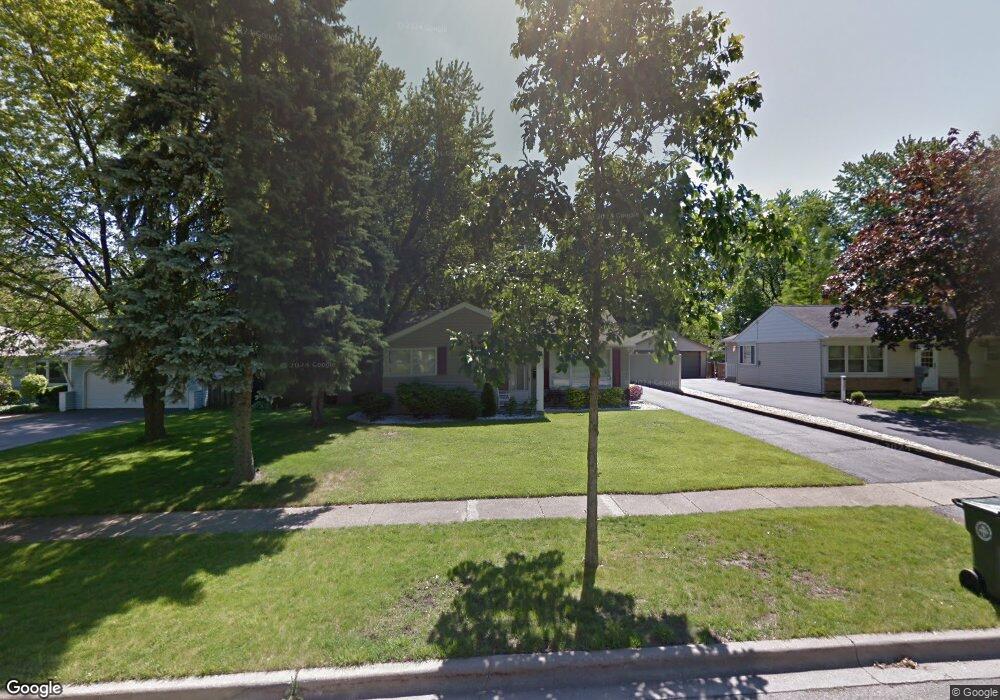
3002 Falcon Ct W Rolling Meadows, IL 60008
Estimated Value: $297,000 - $404,000
3
Beds
1
Bath
1,125
Sq Ft
$295/Sq Ft
Est. Value
About This Home
This home is located at 3002 Falcon Ct W, Rolling Meadows, IL 60008 and is currently estimated at $331,480, approximately $294 per square foot. 3002 Falcon Ct W is a home located in Cook County with nearby schools including Central Road Elementary School, Gale School, and King Elementary School.
Ownership History
Date
Name
Owned For
Owner Type
Purchase Details
Closed on
Oct 3, 2017
Sold by
Dawson Van and Dawson Julie
Bought by
Kropp Thomas J
Current Estimated Value
Home Financials for this Owner
Home Financials are based on the most recent Mortgage that was taken out on this home.
Original Mortgage
$212,800
Outstanding Balance
$177,413
Interest Rate
3.75%
Mortgage Type
New Conventional
Estimated Equity
$154,067
Purchase Details
Closed on
Feb 16, 2000
Sold by
Sblendorio John F and Sblendorio Julianne
Bought by
Dawson Van and Dawson Julie
Home Financials for this Owner
Home Financials are based on the most recent Mortgage that was taken out on this home.
Original Mortgage
$120,800
Interest Rate
7.62%
Create a Home Valuation Report for This Property
The Home Valuation Report is an in-depth analysis detailing your home's value as well as a comparison with similar homes in the area
Home Values in the Area
Average Home Value in this Area
Purchase History
| Date | Buyer | Sale Price | Title Company |
|---|---|---|---|
| Kropp Thomas J | $224,000 | Chicago Title Company | |
| Dawson Van | $151,000 | Professional National Title |
Source: Public Records
Mortgage History
| Date | Status | Borrower | Loan Amount |
|---|---|---|---|
| Open | Kropp Thomas J | $212,800 | |
| Previous Owner | Dawson Van | $120,800 |
Source: Public Records
Tax History Compared to Growth
Tax History
| Year | Tax Paid | Tax Assessment Tax Assessment Total Assessment is a certain percentage of the fair market value that is determined by local assessors to be the total taxable value of land and additions on the property. | Land | Improvement |
|---|---|---|---|---|
| 2024 | $5,727 | $22,000 | $4,290 | $17,710 |
| 2023 | $5,453 | $22,000 | $4,290 | $17,710 |
| 2022 | $5,453 | $22,000 | $4,290 | $17,710 |
| 2021 | $4,961 | $18,310 | $2,535 | $15,775 |
| 2020 | $4,918 | $18,310 | $2,535 | $15,775 |
| 2019 | $4,954 | $20,459 | $2,535 | $17,924 |
| 2018 | $6,163 | $19,027 | $2,340 | $16,687 |
| 2017 | $4,966 | $19,027 | $2,340 | $16,687 |
| 2016 | $4,886 | $19,027 | $2,340 | $16,687 |
| 2015 | $3,902 | $15,016 | $2,145 | $12,871 |
| 2014 | $3,826 | $15,016 | $2,145 | $12,871 |
| 2013 | $3,716 | $15,016 | $2,145 | $12,871 |
Source: Public Records
Map
Nearby Homes
- 3400 Wellington Ct Unit 306
- 3355 Kirchoff Rd Unit 6A
- 3265 Kirchoff Rd Unit 223
- 1 Foxcroft on Auburn
- 3275 Kirchoff Rd Unit 337
- 3125 Town Square Dr Unit 408
- 3805 Fairfax Ave
- 3600 Owl Dr
- 2600 Brookwood Way Dr Unit 316
- 2600 Brookwood Way Dr Unit 305
- 2600 Brookwood Way Dr Unit 214
- 2600 Brookwood Unit 314
- 2600 Brookwood Way Dr Unit 212
- 2401 Rohlwing Rd
- 3316 Trillium Cir
- 2611 South St
- 208 Brookdale Ln
- 200 Edgewood Ln
- 4101 Owl Dr
- 160 E Forest Ln
- 3004 Falcon Ct W
- 3000 Falcon Ct W
- 3607 Falcon Ct N
- 3006 Falcon Ct W
- 3604 Finch Ct
- 3605 Falcon Ct N
- 3606 Finch Ct
- 3100 Falcon Ct W
- 3005 Falcon Ct W
- 3603 Falcon Ct N
- 3009 Falcon Ct W
- 3602 Finch Ct
- 3003 Falcon Ct W
- 3101 Falcon Ct W
- 3102 Falcon Ct W
- 3607 Finch Ct
- 3001 Falcon Ct W
- 3103 Falcon Ct W
- 3001 Owl Dr
- 3604 Falcon Ct N