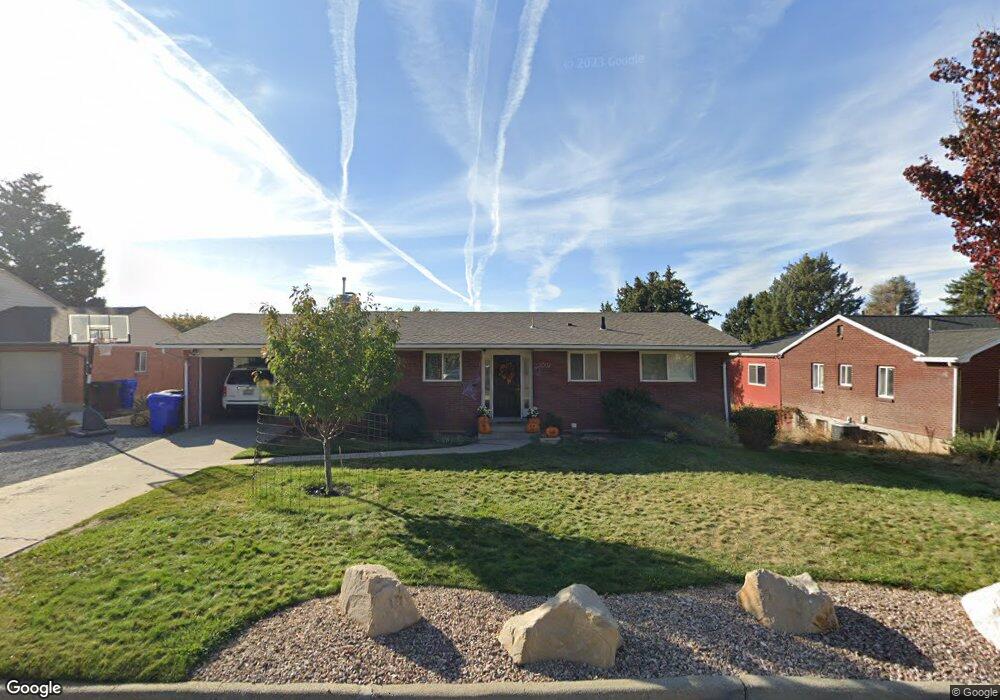
3002 S 300 W Bountiful, UT 84010
Estimated Value: $474,000 - $517,768
4
Beds
2
Baths
1,180
Sq Ft
$421/Sq Ft
Est. Value
About This Home
This home is located at 3002 S 300 W, Bountiful, UT 84010 and is currently estimated at $496,192, approximately $420 per square foot. 3002 S 300 W is a home located in Davis County with nearby schools including Boulton School, South Davis Junior High School, and Woods Cross High School.
Ownership History
Date
Name
Owned For
Owner Type
Purchase Details
Closed on
Dec 6, 2011
Sold by
Barton Leslie
Bought by
Barton Troy Brian and Barton Leslie
Current Estimated Value
Home Financials for this Owner
Home Financials are based on the most recent Mortgage that was taken out on this home.
Original Mortgage
$157,800
Outstanding Balance
$107,812
Interest Rate
4.06%
Mortgage Type
New Conventional
Estimated Equity
$388,380
Purchase Details
Closed on
Jan 22, 2008
Sold by
Orton Frances Patrick and Black Andrea Patrick
Bought by
Barton Leslie
Home Financials for this Owner
Home Financials are based on the most recent Mortgage that was taken out on this home.
Original Mortgage
$168,084
Interest Rate
6.07%
Mortgage Type
FHA
Purchase Details
Closed on
Dec 21, 2001
Sold by
Patrick Ethel Reader Call
Bought by
Patrick Ethel C and Orton Frances Patrick
Create a Home Valuation Report for This Property
The Home Valuation Report is an in-depth analysis detailing your home's value as well as a comparison with similar homes in the area
Home Values in the Area
Average Home Value in this Area
Purchase History
| Date | Buyer | Sale Price | Title Company |
|---|---|---|---|
| Barton Troy Brian | -- | Advanced Title Ins A | |
| Barton Leslie | -- | First American Title | |
| Patrick Ethel C | -- | -- |
Source: Public Records
Mortgage History
| Date | Status | Borrower | Loan Amount |
|---|---|---|---|
| Open | Barton Troy Brian | $157,800 | |
| Closed | Barton Leslie | $168,084 |
Source: Public Records
Tax History Compared to Growth
Tax History
| Year | Tax Paid | Tax Assessment Tax Assessment Total Assessment is a certain percentage of the fair market value that is determined by local assessors to be the total taxable value of land and additions on the property. | Land | Improvement |
|---|---|---|---|---|
| 2025 | $2,927 | $265,650 | $147,248 | $118,402 |
| 2024 | $2,823 | $260,700 | $136,335 | $124,365 |
| 2023 | $2,743 | $457,000 | $246,379 | $210,621 |
| 2022 | $2,682 | $250,250 | $133,356 | $116,894 |
| 2021 | $2,368 | $338,000 | $174,714 | $163,286 |
| 2020 | $2,099 | $300,000 | $147,532 | $152,468 |
| 2019 | $2,086 | $295,000 | $144,645 | $150,355 |
| 2018 | $1,941 | $270,000 | $141,541 | $128,459 |
| 2016 | $1,659 | $132,605 | $50,327 | $82,278 |
| 2015 | $1,599 | $120,835 | $50,327 | $70,508 |
| 2014 | $1,400 | $108,256 | $50,327 | $57,929 |
| 2013 | -- | $100,989 | $42,415 | $58,574 |
Source: Public Records
Map
Nearby Homes
- 2943 S 400 W
- 117 W 3000 S
- 3183 S 500 W
- 527 Applewood Dr
- 3463 S 50 E
- 8 E 3500 S
- 3474 S 100 E
- 217 E 3000 S
- 3238 S 675 W
- 3716 S Oakridge Cir
- 1104 E Fairway Dr
- 438 Indian Springs Rd
- 1036 E Fairway Dr
- 2095 S Main St Unit 17
- 2095 S Main St Unit 23
- 757 W 3200 S
- 2281 S 250 E
- 310 N 675 E
- 33 W Wicker Ln
- 1950 S 200 W Unit 32