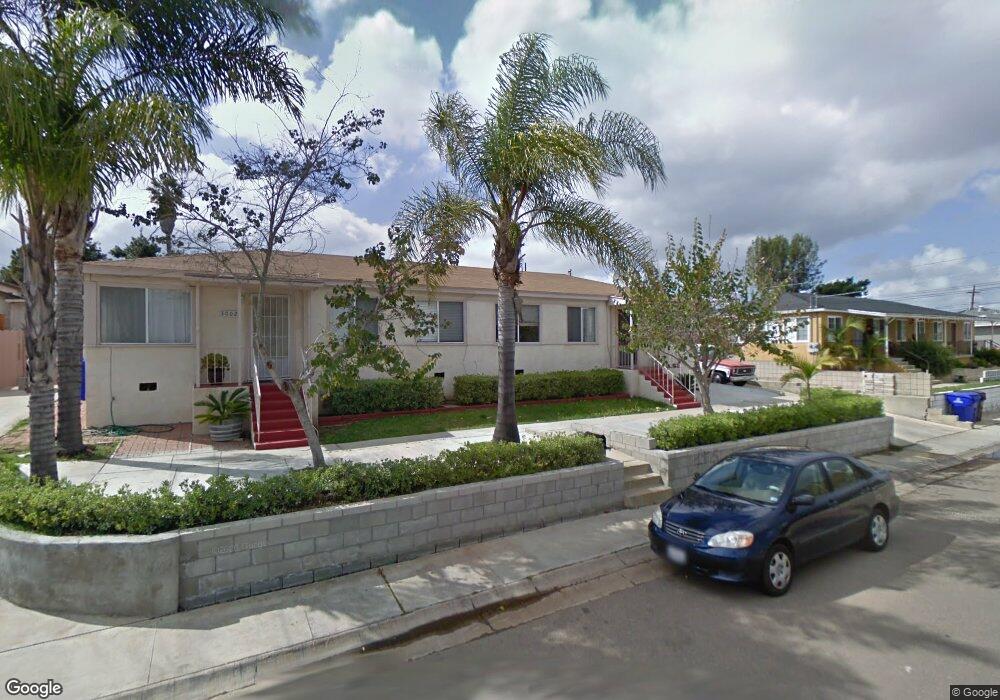
3002 Ulric St Unit 4 San Diego, CA 92111
Linda Vista NeighborhoodEstimated Value: $903,000 - $1,710,000
6
Beds
2
Baths
1,768
Sq Ft
$716/Sq Ft
Est. Value
About This Home
This home is located at 3002 Ulric St Unit 4, San Diego, CA 92111 and is currently estimated at $1,266,654, approximately $716 per square foot. 3002 Ulric St Unit 4 is a home located in San Diego County with nearby schools including Linda Vista Elementary School, Montgomery Middle School, and San Diego Cooperative Charter School.
Ownership History
Date
Name
Owned For
Owner Type
Purchase Details
Closed on
Jun 6, 2017
Sold by
Drobeck Edward J
Bought by
Idio Army Dela Pena
Current Estimated Value
Home Financials for this Owner
Home Financials are based on the most recent Mortgage that was taken out on this home.
Original Mortgage
$115,000
Outstanding Balance
$60,402
Interest Rate
4.05%
Mortgage Type
New Conventional
Estimated Equity
$1,206,252
Purchase Details
Closed on
Nov 14, 2000
Sold by
Drobeck Edward J
Bought by
Drobeck Edward J
Purchase Details
Closed on
Sep 12, 1995
Sold by
Drobeck Edward J
Bought by
Drobeck Edward J
Home Financials for this Owner
Home Financials are based on the most recent Mortgage that was taken out on this home.
Original Mortgage
$138,750
Interest Rate
7.88%
Create a Home Valuation Report for This Property
The Home Valuation Report is an in-depth analysis detailing your home's value as well as a comparison with similar homes in the area
Home Values in the Area
Average Home Value in this Area
Purchase History
| Date | Buyer | Sale Price | Title Company |
|---|---|---|---|
| Idio Army Dela Pena | $250,000 | Lawyers Title Sd | |
| Drobeck Edward J | -- | -- | |
| Drobeck Edward J | -- | Old Republic Title Company |
Source: Public Records
Mortgage History
| Date | Status | Borrower | Loan Amount |
|---|---|---|---|
| Open | Idio Army Dela Pena | $115,000 | |
| Previous Owner | Drobeck Edward J | $138,750 |
Source: Public Records
Tax History Compared to Growth
Tax History
| Year | Tax Paid | Tax Assessment Tax Assessment Total Assessment is a certain percentage of the fair market value that is determined by local assessors to be the total taxable value of land and additions on the property. | Land | Improvement |
|---|---|---|---|---|
| 2025 | $7,965 | $661,529 | $452,627 | $208,902 |
| 2024 | $7,965 | $648,558 | $443,752 | $204,806 |
| 2023 | $7,788 | $635,842 | $435,051 | $200,791 |
| 2022 | $7,578 | $623,375 | $426,521 | $196,854 |
| 2021 | $7,520 | $611,153 | $418,158 | $192,995 |
| 2020 | $7,423 | $604,888 | $413,871 | $191,017 |
| 2019 | $7,285 | $593,028 | $405,756 | $187,272 |
| 2018 | $6,812 | $581,400 | $397,800 | $183,600 |
| 2017 | $80 | $50,708 | $21,075 | $29,633 |
| 2016 | $640 | $49,714 | $20,662 | $29,052 |
| 2015 | $632 | $48,968 | $20,352 | $28,616 |
| 2014 | $623 | $48,010 | $19,954 | $28,056 |
Source: Public Records
Map
Nearby Homes
- 6929 Park Mesa Way Unit 126
- 2868-70 Preece St
- 2818 Nye St
- 3014 Old Bridgeport Way
- 3047 Old Bridgeport Way
- 2675 Comstock St
- 3120 Old Bridgeport Way
- 3226 Old Heather Rd
- 3161 Mount Tami Dr
- 2750 Wheatstone St Unit 113
- 2750 Wheatstone St Unit 105
- 2750 Wheatstone St Unit 89
- 2750 Wheatstone St Unit 64
- 2767 Lancha St
- 3262 Mount Carol Dr
- 6728 Thomson Ct
- 3218 Old Bridgeport Way
- 3298 Old Heather Rd
- 3270 W Fox Run Way Unit 2
- 6737 Thomson Ct
- 2976 Ulric St
- 3012 Ulric St Unit 14
- 6638 Comly Ct
- 3031 Ulric Ct
- 2966 Ulric St
- 3010 Ulric Ct
- 3028 Ulric St
- 6628 Comly Ct
- 3003 Ulric St Unit 5
- 2956 Ulric St
- 3051 Ulric Ct
- 2975 Ulric St
- 6637 Comly Ct
- 3015 Ulric St Unit 17
- 0000 Ulric St
- 2965 Ulric St
- 3040 Ulric St
- 6618 Comly Ct
- 2955 Ulric St
- 3030 Ulric Ct