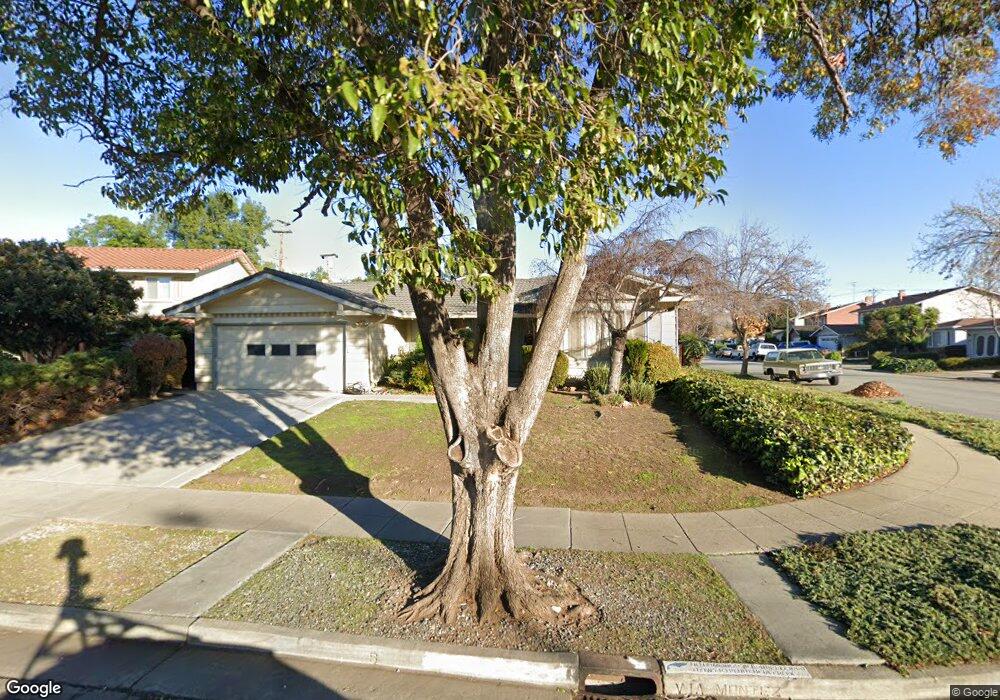
3002 Via Montez San Jose, CA 95132
Capewood NeighborhoodEstimated Value: $1,622,131 - $1,796,000
4
Beds
2
Baths
1,579
Sq Ft
$1,081/Sq Ft
Est. Value
About This Home
This home is located at 3002 Via Montez, San Jose, CA 95132 and is currently estimated at $1,707,033, approximately $1,081 per square foot. 3002 Via Montez is a home located in Santa Clara County with nearby schools including Laneview Elementary School, Morrill Middle School, and Independence High School.
Ownership History
Date
Name
Owned For
Owner Type
Purchase Details
Closed on
Mar 22, 2024
Sold by
Tran Randy Vinh
Bought by
Randy Vinh Tran Family Revocable Living Trust and Tran
Current Estimated Value
Purchase Details
Closed on
Jun 1, 2011
Sold by
Tran Randy V and Huynh Cindy L
Bought by
Tran Randy and Huynh Cindy L
Home Financials for this Owner
Home Financials are based on the most recent Mortgage that was taken out on this home.
Original Mortgage
$338,000
Interest Rate
4.71%
Mortgage Type
New Conventional
Purchase Details
Closed on
Jan 18, 1996
Sold by
Lee Malcolm A and Lee Yasuko
Bought by
Tran Vinh Dat and Huynh Cindy Loan
Home Financials for this Owner
Home Financials are based on the most recent Mortgage that was taken out on this home.
Original Mortgage
$200,000
Interest Rate
7.18%
Create a Home Valuation Report for This Property
The Home Valuation Report is an in-depth analysis detailing your home's value as well as a comparison with similar homes in the area
Home Values in the Area
Average Home Value in this Area
Purchase History
| Date | Buyer | Sale Price | Title Company |
|---|---|---|---|
| Randy Vinh Tran Family Revocable Living Trust | -- | None Listed On Document | |
| Tran Randy | -- | Accommodation | |
| Tran Vinh Dat | $223,000 | Golden California Title Co |
Source: Public Records
Mortgage History
| Date | Status | Borrower | Loan Amount |
|---|---|---|---|
| Previous Owner | Tran Randy | $338,000 | |
| Previous Owner | Tran Vinh Dat | $200,000 |
Source: Public Records
Tax History Compared to Growth
Tax History
| Year | Tax Paid | Tax Assessment Tax Assessment Total Assessment is a certain percentage of the fair market value that is determined by local assessors to be the total taxable value of land and additions on the property. | Land | Improvement |
|---|---|---|---|---|
| 2025 | $6,151 | $370,353 | $148,005 | $222,348 |
| 2024 | $6,151 | $363,092 | $145,103 | $217,989 |
| 2023 | $6,017 | $355,973 | $142,258 | $213,715 |
| 2022 | $5,985 | $348,994 | $139,469 | $209,525 |
| 2021 | $5,769 | $342,152 | $136,735 | $205,417 |
| 2020 | $5,572 | $338,644 | $135,333 | $203,311 |
| 2019 | $5,357 | $332,005 | $132,680 | $199,325 |
| 2018 | $5,272 | $325,496 | $130,079 | $195,417 |
| 2017 | $5,286 | $319,115 | $127,529 | $191,586 |
| 2016 | $5,064 | $312,859 | $125,029 | $187,830 |
| 2015 | $5,000 | $308,160 | $123,151 | $185,009 |
| 2014 | $4,439 | $302,124 | $120,739 | $181,385 |
Source: Public Records
Map
Nearby Homes
- 1982 Plaza Montez
- 3108 Kermath Dr
- 3139 Laneview Dr
- 2844 Parkrow Ln
- 1756 Valhalla Ct
- 2075 Lakewood Dr
- 3093 Melchester Dr
- 2085 Ashwood Ln
- 3070 Ironside Ct
- 3248 Woody Ln
- 3252 Cropley Ave
- 2625 Autumnvale Dr
- 2158 Capitol Park Ct
- 1710 Clear Lake Ave
- 1693 Peachwood Dr
- 3211 Parkhaven Dr
- 2200 Beech Cir
- 2559 Alveswood Cir
- 1612 Tahoe Dr
- 1536 Sonoma Dr
- 3004 Via Montez
- 1934 Junewood Ave
- 3008 Via Montez
- 1928 Junewood Ave
- 1952 Junewood Ave
- 1937 Junewood Ave
- 1943 Junewood Ave
- 1971 Plaza Montez
- 1931 Junewood Ave
- 1949 Junewood Ave
- 1965 Plaza Montez
- 3005 Via Montez
- 3022 Via Montez
- 1925 Junewood Ave
- 1922 Junewood Ave
- 1958 Junewood Ave
- 1955 Junewood Ave
- 1983 Plaza Montez
- 1919 Junewood Ave
- 1957 Plaza Montez