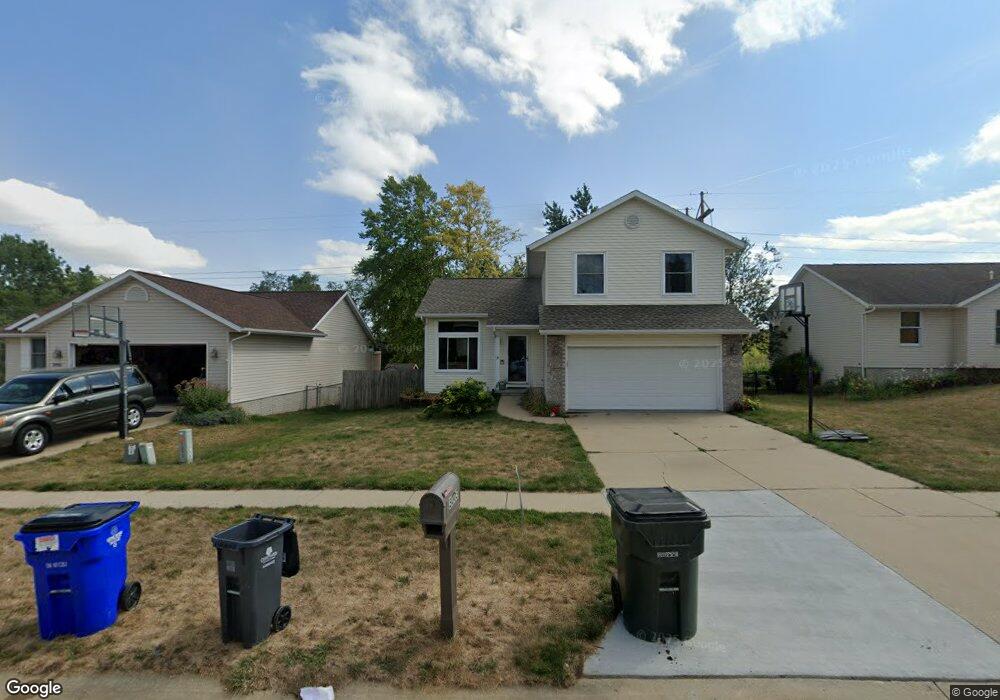
3003 38th Ave SW Cedar Rapids, IA 52404
Estimated Value: $282,000 - $305,000
3
Beds
3
Baths
1,404
Sq Ft
$209/Sq Ft
Est. Value
About This Home
This home is located at 3003 38th Ave SW, Cedar Rapids, IA 52404 and is currently estimated at $293,822, approximately $209 per square foot. 3003 38th Ave SW is a home located in Linn County with nearby schools including Prairie Crest Elementary School, Prairie View Elementary School, and Prairie Ridge Elementary School.
Ownership History
Date
Name
Owned For
Owner Type
Purchase Details
Closed on
Jul 9, 2003
Sold by
Ayers Christopher W and Ayers Elizabeth M
Bought by
Evans Adrian and Evans Amy Jo
Current Estimated Value
Home Financials for this Owner
Home Financials are based on the most recent Mortgage that was taken out on this home.
Original Mortgage
$151,300
Outstanding Balance
$64,858
Interest Rate
5.37%
Mortgage Type
Unknown
Estimated Equity
$228,964
Purchase Details
Closed on
May 17, 2000
Sold by
High Development Corp
Bought by
Ayers Christopher W and Ayers Elizabeth M
Home Financials for this Owner
Home Financials are based on the most recent Mortgage that was taken out on this home.
Original Mortgage
$136,325
Interest Rate
8.21%
Purchase Details
Closed on
Jan 10, 2000
Sold by
Executive Construction Company
Bought by
High Development Corp
Home Financials for this Owner
Home Financials are based on the most recent Mortgage that was taken out on this home.
Original Mortgage
$105,000
Interest Rate
7.89%
Mortgage Type
Credit Line Revolving
Create a Home Valuation Report for This Property
The Home Valuation Report is an in-depth analysis detailing your home's value as well as a comparison with similar homes in the area
Home Values in the Area
Average Home Value in this Area
Purchase History
| Date | Buyer | Sale Price | Title Company |
|---|---|---|---|
| Evans Adrian | $155,500 | -- | |
| Ayers Christopher W | $143,000 | -- | |
| High Development Corp | $22,000 | -- |
Source: Public Records
Mortgage History
| Date | Status | Borrower | Loan Amount |
|---|---|---|---|
| Open | Evans Adrian | $151,300 | |
| Previous Owner | Ayers Christopher W | $136,325 | |
| Previous Owner | High Development Corp | $105,000 |
Source: Public Records
Tax History Compared to Growth
Tax History
| Year | Tax Paid | Tax Assessment Tax Assessment Total Assessment is a certain percentage of the fair market value that is determined by local assessors to be the total taxable value of land and additions on the property. | Land | Improvement |
|---|---|---|---|---|
| 2025 | $4,932 | $266,700 | $52,600 | $214,100 |
| 2024 | $4,920 | $260,300 | $49,200 | $211,100 |
| 2023 | $4,920 | $260,300 | $49,200 | $211,100 |
| 2022 | $4,508 | $222,100 | $45,800 | $176,300 |
| 2021 | $4,506 | $207,400 | $39,000 | $168,400 |
| 2020 | $4,506 | $197,900 | $39,000 | $158,900 |
| 2019 | $3,948 | $176,000 | $33,900 | $142,100 |
| 2018 | $3,840 | $176,000 | $33,900 | $142,100 |
| 2017 | $3,722 | $175,000 | $33,900 | $141,100 |
| 2016 | $3,722 | $172,000 | $33,900 | $138,100 |
| 2015 | $3,712 | $172,521 | $33,920 | $138,601 |
| 2014 | $3,712 | $172,521 | $33,920 | $138,601 |
| 2013 | $3,528 | $172,521 | $33,920 | $138,601 |
Source: Public Records
Map
Nearby Homes
- 3737 Monarch Dr SW
- 3619 King Dr SW
- 3205 33rd Ave SW
- 3226 Bramble Rd SW
- 3221 Bramble Rd SW
- 3514 Sokol Ln SW
- 3508 Sokol Ln SW
- 3108 Huxley Ln SW
- 3502 Sokol Ln SW
- 3424 Sokol Ln SW
- 3406 Sokol Ln SW
- 3715 33rd Ave SW Unit 4.8 AC
- 3715 33rd Ave SW Unit 5.8 AC
- 3715 33rd Ave SW Unit 1 AC
- 3132 Pebble Dr SW
- 3503 Sokol Ln SW
- 3431 Sokol Ln SW
- 3009 Carriage Dr SW
- 3302 Sokol Ln SW
- 2521 Radcliffe Ct SW
- 3009 38th Ave SW
- 2925 38th Ave SW
- 3015 38th Ave SW
- 2919 38th Ave SW
- 3740 Prince Dr SW
- 3737 Knight Dr SW
- 3021 38th Ave SW
- 2913 38th Ave SW
- 3734 Prince Dr SW
- 3731 Knight Dr SW
- 3739 Prince Dr SW
- 3105 38th Ave SW
- 2907 38th Ave SW
- 3728 Prince Dr SW
- 3733 Prince Dr SW
- 3725 Knight Dr SW
- 3736 Knight Dr SW
- 3111 38th Ave SW
- 3727 Prince Dr SW
- 3730 Knight Dr SW