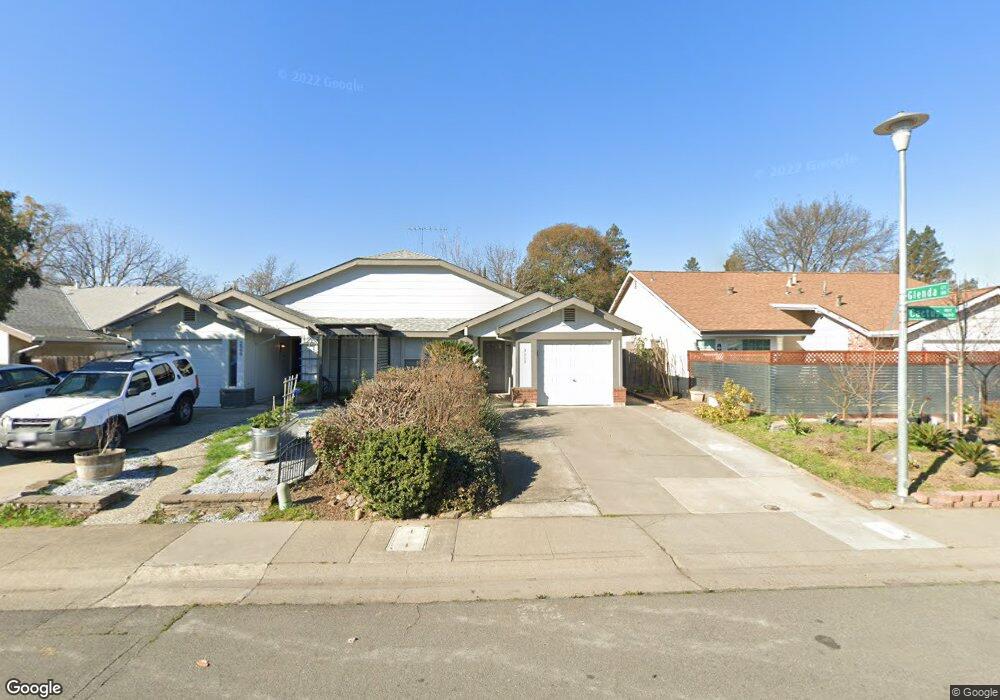
3003 Cactus Way Sacramento, CA 95833
South Natomas NeighborhoodEstimated Value: $305,000 - $384,000
2
Beds
2
Baths
944
Sq Ft
$375/Sq Ft
Est. Value
About This Home
This home is located at 3003 Cactus Way, Sacramento, CA 95833 and is currently estimated at $353,897, approximately $374 per square foot. 3003 Cactus Way is a home located in Sacramento County with nearby schools including Hazel Strauch Elementary School, Rio Tierra Junior High School, and Grant Union High School.
Ownership History
Date
Name
Owned For
Owner Type
Purchase Details
Closed on
Jul 13, 2017
Sold by
Schmelzer Karen A
Bought by
Schmelzer Marcia A and Mcgown Michael R
Current Estimated Value
Purchase Details
Closed on
Oct 10, 2000
Sold by
Leyson Dianne M G
Bought by
Canas Joseph R
Purchase Details
Closed on
Nov 22, 1999
Sold by
Canas Jose Ricardo
Bought by
Canas Michelle L
Home Financials for this Owner
Home Financials are based on the most recent Mortgage that was taken out on this home.
Original Mortgage
$80,100
Interest Rate
5.25%
Mortgage Type
Purchase Money Mortgage
Purchase Details
Closed on
Nov 18, 1993
Sold by
Schoenfield Albert and A & F Schoenfield Living Trust
Bought by
Leyson Diane Michelle G
Home Financials for this Owner
Home Financials are based on the most recent Mortgage that was taken out on this home.
Original Mortgage
$60,000
Interest Rate
8.75%
Create a Home Valuation Report for This Property
The Home Valuation Report is an in-depth analysis detailing your home's value as well as a comparison with similar homes in the area
Home Values in the Area
Average Home Value in this Area
Purchase History
| Date | Buyer | Sale Price | Title Company |
|---|---|---|---|
| Schmelzer Marcia A | -- | None Available | |
| Canas Joseph R | -- | -- | |
| Canas Michelle L | -- | Fidelity National Title Co | |
| Canas Michelle L | -- | Fidelity National Title Co | |
| Leyson Diane Michelle G | $80,000 | North American Title Co Inc |
Source: Public Records
Mortgage History
| Date | Status | Borrower | Loan Amount |
|---|---|---|---|
| Previous Owner | Canas Michelle L | $80,100 | |
| Previous Owner | Leyson Diane Michelle G | $60,000 | |
| Closed | Leyson Diane Michelle G | $8,000 |
Source: Public Records
Tax History Compared to Growth
Tax History
| Year | Tax Paid | Tax Assessment Tax Assessment Total Assessment is a certain percentage of the fair market value that is determined by local assessors to be the total taxable value of land and additions on the property. | Land | Improvement |
|---|---|---|---|---|
| 2025 | $3,144 | $250,317 | $73,956 | $176,361 |
| 2024 | $3,144 | $245,409 | $72,506 | $172,903 |
| 2023 | $3,157 | $240,598 | $71,085 | $169,513 |
| 2022 | $2,990 | $235,882 | $69,692 | $166,190 |
| 2021 | $2,977 | $231,258 | $68,326 | $162,932 |
| 2020 | $2,947 | $228,888 | $67,626 | $161,262 |
| 2019 | $2,909 | $224,400 | $66,300 | $158,100 |
| 2018 | $2,773 | $220,000 | $65,000 | $155,000 |
| 2017 | $2,657 | $200,593 | $49,910 | $150,683 |
| 2016 | $2,604 | $196,661 | $48,932 | $147,729 |
| 2015 | $2,366 | $185,687 | $46,201 | $139,486 |
| 2014 | $2,347 | $176,845 | $44,001 | $132,844 |
Source: Public Records
Map
Nearby Homes
- 865 Regatta Dr
- 1053 Westward Way
- 3125 Iberian Dr
- 1 Inca Ct
- 1350 Pebblewood Dr
- 721 Potomac Ave
- 1355 Senida Way
- 19 Azorean Ct
- 760 Los Lunas Way
- 3306 Lunar Sky Walk
- 841 Haggin Ave
- 981 San Juan Rd
- 3318 Lunar Sky Walk
- 969 San Juan Rd
- 977 Scenic Sky Ln
- 3318 Aurora Sky Walk
- 2803 Glen Arven Way
- Plan 1296 at Skylar
- Plan 1415 at Skylar
- Plan 1306 at Skylar
- 2999 Cactus Way
- 3007 Cactus Way
- 2995 Cactus Way
- 3011 Cactus Way
- 27 Santa Domingo Ct
- 2991 Cactus Way
- 26 Santa Domingo Ct
- 2998 Cactus Way
- 3015 Cactus Way
- 2994 Cactus Way
- 2 Glenda Ct
- 2 Glenda Ct
- 1145 Socorro Way
- 2987 Cactus Way
- 23 Santa Domingo Ct
- 3012 Cactus Way
- 2990 Cactus Way
- 1149 Socorro Way
- 22 Santa Domingo Ct
- 0 Glendora Ct