Estimated Value: $392,061 - $462,000
4
Beds
3
Baths
2,640
Sq Ft
$164/Sq Ft
Est. Value
About This Home
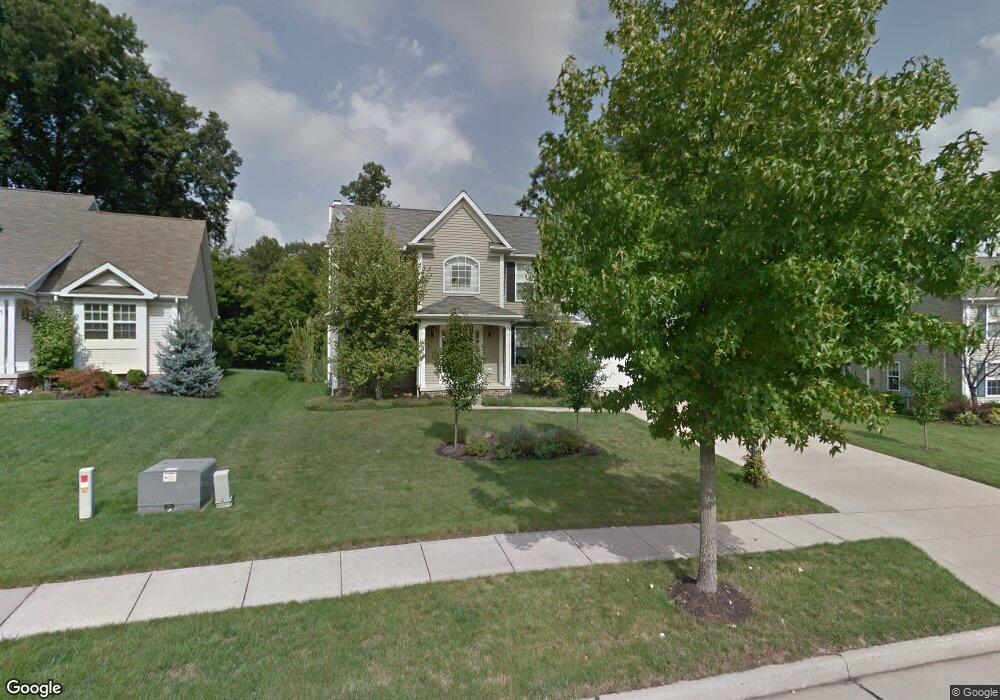
This home is located at 3003 Ravineview Cir, Stow, OH 44224 and is currently estimated at $433,515, approximately $164 per square foot. 3003 Ravineview Cir is a home located in Summit County with nearby schools including Stow-Munroe Falls High School, Primrose School of Hudson, and Seton Catholic Elementary School.
Ownership History
Date
Name
Owned For
Owner Type
Purchase Details
Closed on
Aug 29, 2019
Sold by
Duff Aaron R and Duff Lydia R
Bought by
Cook Brian A and Cook Melissa S
Current Estimated Value
Home Financials for this Owner
Home Financials are based on the most recent Mortgage that was taken out on this home.
Original Mortgage
$279,900
Outstanding Balance
$245,672
Interest Rate
3.7%
Mortgage Type
VA
Estimated Equity
$187,843
Purchase Details
Closed on
Jul 26, 2000
Sold by
Snavely Timbercreek Inc
Bought by
Duff Aaron R and Duff Lydia R
Home Financials for this Owner
Home Financials are based on the most recent Mortgage that was taken out on this home.
Original Mortgage
$184,059
Interest Rate
8.12%
Purchase Details
Closed on
Jan 17, 1997
Sold by
Valore Management Co Inc
Bought by
Snavely Timbercreek Inc
Home Financials for this Owner
Home Financials are based on the most recent Mortgage that was taken out on this home.
Original Mortgage
$1,500,000
Interest Rate
7.54%
Mortgage Type
New Conventional
Create a Home Valuation Report for This Property
The Home Valuation Report is an in-depth analysis detailing your home's value as well as a comparison with similar homes in the area
Home Values in the Area
Average Home Value in this Area
Purchase History
| Date | Buyer | Sale Price | Title Company |
|---|---|---|---|
| Cook Brian A | $289,900 | None Available | |
| Duff Aaron R | $216,540 | -- | |
| Snavely Timbercreek Inc | $2,267,598 | -- |
Source: Public Records
Mortgage History
| Date | Status | Borrower | Loan Amount |
|---|---|---|---|
| Open | Cook Brian A | $279,900 | |
| Previous Owner | Duff Aaron R | $184,059 | |
| Previous Owner | Snavely Timbercreek Inc | $1,500,000 | |
| Closed | Duff Aaron R | $10,827 |
Source: Public Records
Tax History
| Year | Tax Paid | Tax Assessment Tax Assessment Total Assessment is a certain percentage of the fair market value that is determined by local assessors to be the total taxable value of land and additions on the property. | Land | Improvement |
|---|---|---|---|---|
| 2024 | $6,743 | $103,695 | $18,127 | $85,568 |
| 2023 | $6,743 | $103,695 | $18,127 | $85,568 |
| 2022 | $6,643 | $93,471 | $16,331 | $77,140 |
| 2021 | $5,856 | $93,471 | $16,331 | $77,140 |
| 2020 | $5,458 | $93,470 | $16,330 | $77,140 |
| 2019 | $5,192 | $86,660 | $16,010 | $70,650 |
| 2018 | $5,107 | $86,660 | $16,010 | $70,650 |
| 2017 | $4,758 | $86,660 | $16,010 | $70,650 |
| 2016 | $4,898 | $78,430 | $16,010 | $62,420 |
| 2015 | $4,758 | $78,430 | $16,010 | $62,420 |
| 2014 | $4,763 | $78,430 | $16,010 | $62,420 |
| 2013 | $4,032 | $66,680 | $16,010 | $50,670 |
Source: Public Records
Map
Nearby Homes
- 5361 Diana Lynn Dr
- 5518 Pond Ct
- 1995 Weston Dr
- 5163 Beckett Ridge
- 5150 Bayside Lake Blvd
- V/L Norton Rd
- 2221 Crockett Cir
- 5050 Lake Point Ct
- 2353 W Hale Dr
- 5091 Ridge Meadow Dr
- 4534 Foresthill Rd
- 2352 Becket Cir
- 2279 Becket Cir
- 4556 Fishcreek Rd
- 4544 Fishcreek Rd
- 5123 Sodalite Dr
- 2344 Echo Valley Dr
- 490 Johnson Rd
- 5866 Ogilby Dr
- 4623 Cox Dr
- 2991 Ravineview Cir
- 3019 Ravineview Cir
- 2983 Ravineview Cir
- 2990 Ravineview Cir
- 3006 Ravineview Cir
- 2980 Ravineview Cir
- 5524 Timbercreek Ln
- 2970 Ravineview Cir
- 2961 Ravineview Cir
- 3031 Ravineview Cir
- 5491 Timbercreek Ln
- 3030 Ravineview Cir
- 5499 Timbercreek Ln
- 2960 Ravineview Cir
- 5462 Timbercreek Ln
- 5528 Timbercreek Ln
- 2951 Ravineview Cir
- 5538 Timbercreek Ln
- 5457 Timbercreek Ln
- 3041 Ravineview Cir
Your Personal Tour Guide
Ask me questions while you tour the home.