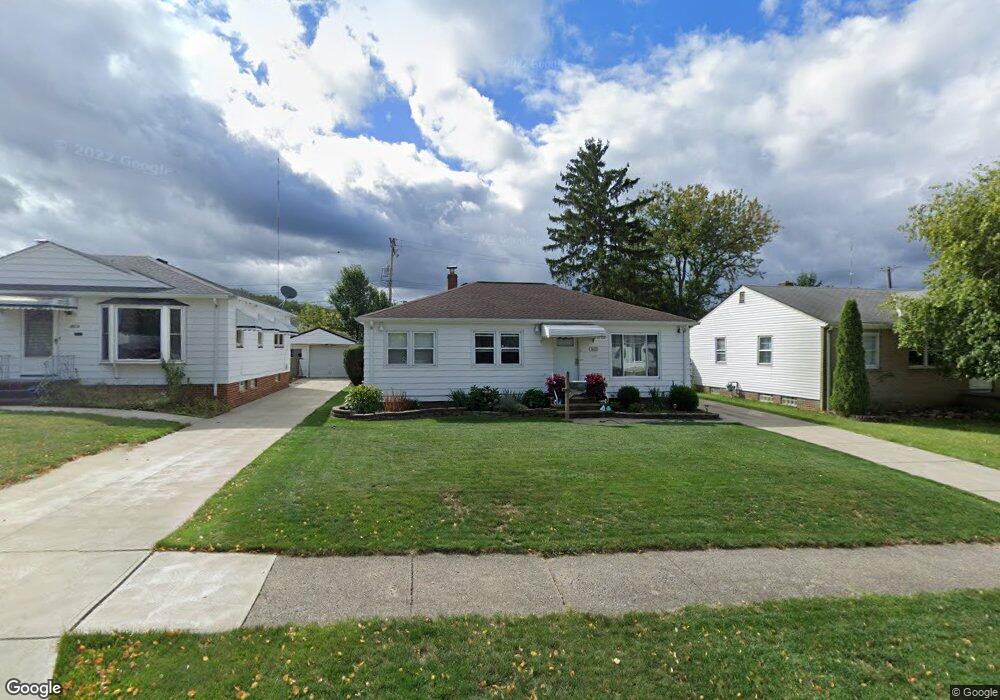
3003 Standish Ave Cleveland, OH 44134
Estimated Value: $190,762 - $207,000
3
Beds
1
Bath
1,064
Sq Ft
$190/Sq Ft
Est. Value
About This Home
This home is located at 3003 Standish Ave, Cleveland, OH 44134 and is currently estimated at $202,191, approximately $190 per square foot. 3003 Standish Ave is a home located in Cuyahoga County with nearby schools including Shiloh Middle School, Dentzler Elementary School, and Parma High School.
Ownership History
Date
Name
Owned For
Owner Type
Purchase Details
Closed on
May 16, 2006
Sold by
Lasiychuk Vasil and Lasiychuk Galina
Bought by
Oshrukevych Yuriy I and Oshurkevych Tetyana S
Current Estimated Value
Home Financials for this Owner
Home Financials are based on the most recent Mortgage that was taken out on this home.
Original Mortgage
$126,850
Outstanding Balance
$74,387
Interest Rate
6.62%
Mortgage Type
FHA
Estimated Equity
$127,804
Purchase Details
Closed on
Jul 1, 2004
Sold by
Soderstrom Kurt F
Bought by
Lasiychuk Vasil and Lasiychuk Galina
Home Financials for this Owner
Home Financials are based on the most recent Mortgage that was taken out on this home.
Original Mortgage
$104,500
Interest Rate
6.39%
Mortgage Type
Purchase Money Mortgage
Purchase Details
Closed on
Sep 28, 2000
Sold by
Soderstrom Herman F
Bought by
Soderstrom Herman F and Soderstrom Esther L
Purchase Details
Closed on
Jan 1, 1975
Bought by
Soderstrom Herman F and Soderstrom Esther
Create a Home Valuation Report for This Property
The Home Valuation Report is an in-depth analysis detailing your home's value as well as a comparison with similar homes in the area
Home Values in the Area
Average Home Value in this Area
Purchase History
| Date | Buyer | Sale Price | Title Company |
|---|---|---|---|
| Oshrukevych Yuriy I | $135,000 | Chicago Title Insurance C | |
| Lasiychuk Vasil | $123,000 | Enterprise Title Agency | |
| Soderstrom Herman F | -- | -- | |
| Soderstrom Herman F | -- | -- |
Source: Public Records
Mortgage History
| Date | Status | Borrower | Loan Amount |
|---|---|---|---|
| Open | Oshrukevych Yuriy I | $126,850 | |
| Closed | Oshrukevych Yuriy I | $5,000 | |
| Previous Owner | Lasiychuk Vasil | $104,500 |
Source: Public Records
Tax History Compared to Growth
Tax History
| Year | Tax Paid | Tax Assessment Tax Assessment Total Assessment is a certain percentage of the fair market value that is determined by local assessors to be the total taxable value of land and additions on the property. | Land | Improvement |
|---|---|---|---|---|
| 2024 | $3,568 | $58,100 | $11,375 | $46,725 |
| 2023 | $2,989 | $41,550 | $9,000 | $32,550 |
| 2022 | $2,964 | $41,545 | $8,995 | $32,550 |
| 2021 | $3,047 | $41,550 | $9,000 | $32,550 |
| 2020 | $3,189 | $38,960 | $7,390 | $31,570 |
| 2019 | $3,059 | $111,300 | $21,100 | $90,200 |
| 2018 | $3,079 | $38,960 | $7,390 | $31,570 |
| 2017 | $3,073 | $36,410 | $6,060 | $30,350 |
| 2016 | $3,055 | $36,410 | $6,060 | $30,350 |
| 2015 | $3,103 | $36,410 | $6,060 | $30,350 |
| 2014 | $3,103 | $39,130 | $6,510 | $32,620 |
Source: Public Records
Map
Nearby Homes
- 2811 Dellwood Dr
- 3407 Dellwood Dr
- 2901 Wales Ave
- 2809 Wales Ave
- 4001 W Ridgewood Dr
- 6482 Concord Dr
- 6480 State Rd Unit F10
- 2821 Parklane Dr
- 4302 Woodrow Ave
- 6185 Yorktown Dr
- 6474 State Rd Unit I-10
- 2010 Grantwood Dr
- 3408 Parklane Dr
- 4002 Maplecrest Ave
- 3436 Heresford Dr
- 4507 Grantwood Dr
- 6468 State Rd Unit L11
- 3430 Park Dr
- 4601 W Ridgewood Dr
- 1417 Roanoke Dr
- 2923 Standish Ave
- 3011 Standish Ave
- 2919 Standish Ave
- 3015 Standish Ave
- 3014 Alden Dr
- 3030 Alden Dr
- 2998 Alden Dr
- 3044 Alden Dr
- 3019 Standish Ave
- 3002 Standish Ave
- 3006 Standish Ave
- 2982 Alden Dr
- 2922 Standish Ave
- 3060 Alden Dr
- 3010 Standish Ave
- 2918 Standish Ave
- 3014 Standish Ave
- 2911 Standish Ave
- 2964 Alden Dr
- 3076 Alden Dr