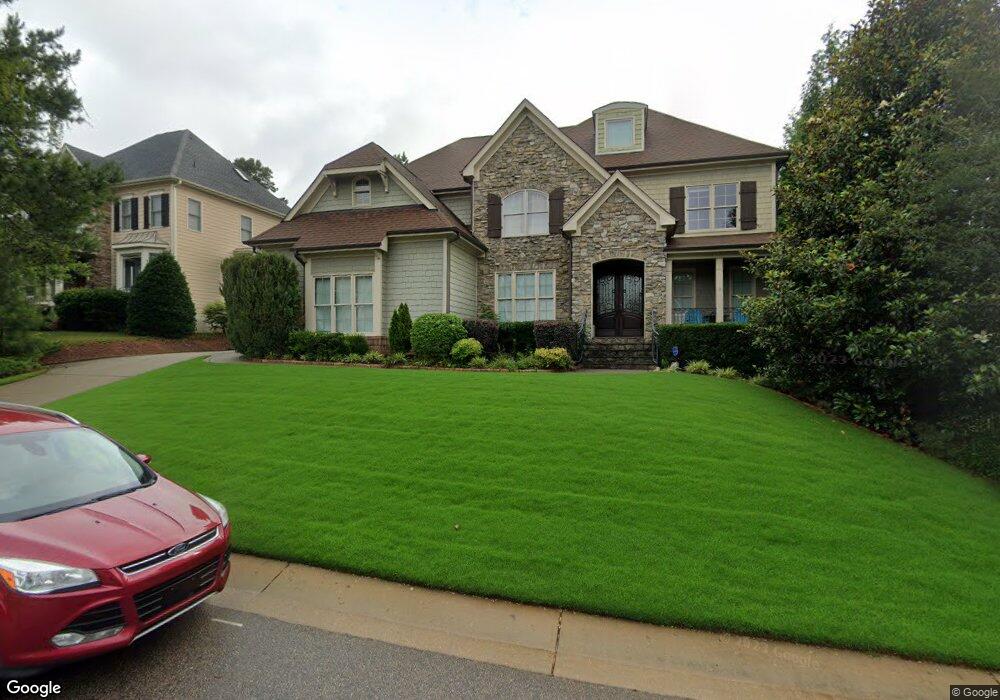
3005 Herdsman Way Raleigh, NC 27614
Falls Lake NeighborhoodEstimated Value: $853,000 - $1,030,000
5
Beds
4
Baths
3,700
Sq Ft
$249/Sq Ft
Est. Value
About This Home
This home is located at 3005 Herdsman Way, Raleigh, NC 27614 and is currently estimated at $920,313, approximately $248 per square foot. 3005 Herdsman Way is a home located in Wake County with nearby schools including Wakefield Elementary School, Wakefield Middle, and Wakefield High School.
Ownership History
Date
Name
Owned For
Owner Type
Purchase Details
Closed on
Jun 20, 2017
Sold by
Johnson Alexis N and Johnson Erik A
Bought by
Slabyak Dimitry and Ginzburg Zoya
Current Estimated Value
Home Financials for this Owner
Home Financials are based on the most recent Mortgage that was taken out on this home.
Original Mortgage
$424,100
Outstanding Balance
$352,763
Interest Rate
4.02%
Mortgage Type
New Conventional
Estimated Equity
$567,550
Purchase Details
Closed on
Jun 10, 2008
Sold by
Homestead Building Co
Bought by
Johnson Alexis N and Johnson Erik A
Home Financials for this Owner
Home Financials are based on the most recent Mortgage that was taken out on this home.
Original Mortgage
$82,770
Interest Rate
6.02%
Mortgage Type
Credit Line Revolving
Purchase Details
Closed on
May 19, 2006
Sold by
Tgl Wilson Llc
Bought by
Homestead Building Co
Purchase Details
Closed on
Jun 1, 2005
Sold by
Wakefield Apartments 3 Investment Llc
Bought by
Tgl Wilson Llc
Create a Home Valuation Report for This Property
The Home Valuation Report is an in-depth analysis detailing your home's value as well as a comparison with similar homes in the area
Home Values in the Area
Average Home Value in this Area
Purchase History
| Date | Buyer | Sale Price | Title Company |
|---|---|---|---|
| Slabyak Dimitry | $270,000 | None Available | |
| Johnson Alexis N | $555,500 | None Available | |
| Homestead Building Co | $290,000 | None Available | |
| Tgl Wilson Llc | $3,700,000 | -- |
Source: Public Records
Mortgage History
| Date | Status | Borrower | Loan Amount |
|---|---|---|---|
| Open | Slabyak Dimitry | $424,100 | |
| Previous Owner | Johnson Alexis N | $82,770 | |
| Previous Owner | Johnson Alexis N | $417,000 |
Source: Public Records
Tax History Compared to Growth
Tax History
| Year | Tax Paid | Tax Assessment Tax Assessment Total Assessment is a certain percentage of the fair market value that is determined by local assessors to be the total taxable value of land and additions on the property. | Land | Improvement |
|---|---|---|---|---|
| 2025 | $8,401 | $961,017 | $110,000 | $851,017 |
| 2024 | $8,366 | $961,017 | $110,000 | $851,017 |
| 2023 | $6,217 | $568,571 | $65,000 | $503,571 |
| 2022 | $5,777 | $568,571 | $65,000 | $503,571 |
| 2021 | $5,552 | $568,571 | $65,000 | $503,571 |
| 2020 | $5,451 | $568,571 | $65,000 | $503,571 |
| 2019 | $5,939 | $510,774 | $66,000 | $444,774 |
| 2018 | $5,454 | $497,313 | $66,000 | $431,313 |
| 2017 | $5,194 | $497,313 | $66,000 | $431,313 |
| 2016 | $5,087 | $497,313 | $66,000 | $431,313 |
| 2015 | $5,774 | $555,699 | $122,000 | $433,699 |
| 2014 | $5,476 | $555,699 | $122,000 | $433,699 |
Source: Public Records
Map
Nearby Homes
- 12308 Bunchgrass Ln
- 12301 Corvus Rd
- 12204 Kaysmount Ct
- 12400 Village Gate Way
- 12412 Fieldmist Dr
- 12452 Richmond Run Dr
- 10900 Common Oaks Dr
- 14200 Falls of Neuse Rd
- 12617 Richmond Run Dr
- 10606 Brookside Reserve Rd
- 3005 Osterley St
- 2301 Narrawood St
- 10608 Brookside Reserve Rd
- 10610 Brookside Reserve Rd
- 2738 Garden Knoll Ln
- 2717 Cypress Point Ln
- 3220 Queensland Rd
- 2306 Carriage Oaks Dr
- 10609 Brookside Reserve Rd
- 10605 Brookside Reserve Rd
- 3005 Herdsman Way Unit 3791
- 12401 Beauvoir St
- 3001 Herdsman Way
- 3001 Herdsman Way Unit 3790
- 12404 Angel Falls Rd
- 12407 Beauvoir St
- 12407 Beauvoir St Unit 3793
- 3004 Herdsman Way
- 3008 Herdsman Way
- 12408 Angel Falls Rd
- 12411 Beauvoir St
- 12411 Beauvoir St Unit 3794
- 3000 Herdsman Way
- 3012 Herdsman Way
- 12400 Beauvoir St
- 12401 Angel Falls Rd
- 12401 Angel Falls Rd Unit 3788
- 2918 Schubba Ct
- 12408 Beauvoir St
- 3100 Herdsman Way