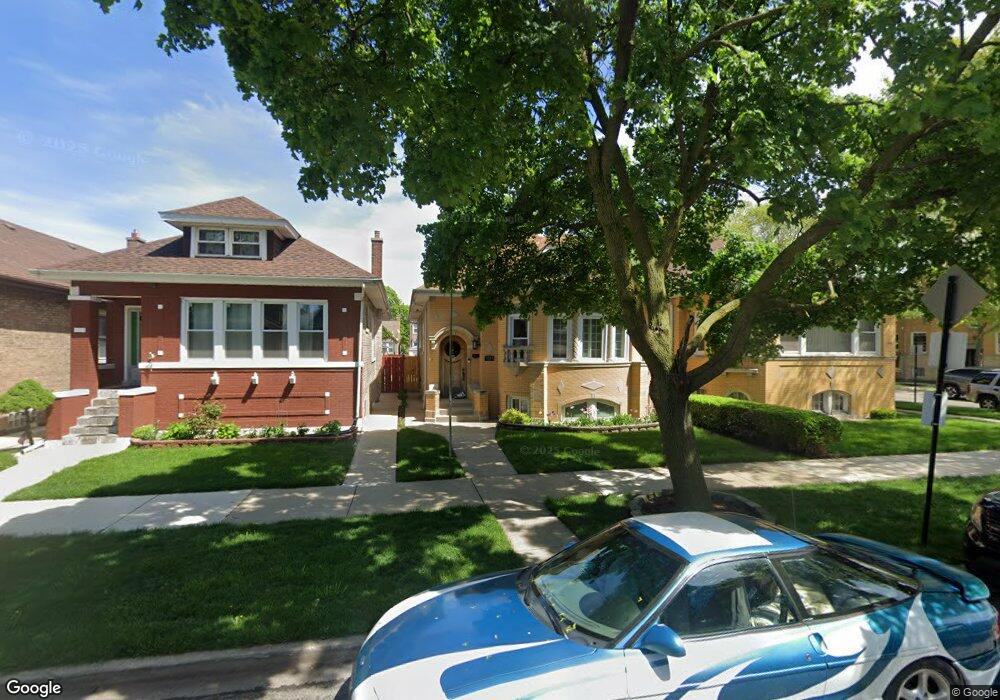
3005 N Linder Ave Chicago, IL 60641
Cragin NeighborhoodEstimated Value: $338,000 - $443,000
3
Beds
1
Bath
1,442
Sq Ft
$282/Sq Ft
Est. Value
About This Home
This home is located at 3005 N Linder Ave, Chicago, IL 60641 and is currently estimated at $406,629, approximately $281 per square foot. 3005 N Linder Ave is a home located in Cook County with nearby schools including Camras Elementary School, Foreman College and Career Academy, and Horizon Science Academy-Belmont.
Ownership History
Date
Name
Owned For
Owner Type
Purchase Details
Closed on
Jul 8, 2003
Sold by
Alvarez Daniel and Alvarez Maria
Bought by
Martinez Jeanette
Current Estimated Value
Home Financials for this Owner
Home Financials are based on the most recent Mortgage that was taken out on this home.
Original Mortgage
$285,000
Interest Rate
4.37%
Mortgage Type
Unknown
Purchase Details
Closed on
May 18, 2001
Sold by
Duran Miguel
Bought by
Alvarez Daniel and Alvarez Maria E
Home Financials for this Owner
Home Financials are based on the most recent Mortgage that was taken out on this home.
Original Mortgage
$205,000
Interest Rate
7.16%
Purchase Details
Closed on
Jul 20, 2000
Sold by
Tabor Waldemar B and Tabor Josephine M
Bought by
Alvarez Daniel and Alvarez Maria
Home Financials for this Owner
Home Financials are based on the most recent Mortgage that was taken out on this home.
Original Mortgage
$179,448
Interest Rate
8.31%
Mortgage Type
FHA
Create a Home Valuation Report for This Property
The Home Valuation Report is an in-depth analysis detailing your home's value as well as a comparison with similar homes in the area
Home Values in the Area
Average Home Value in this Area
Purchase History
| Date | Buyer | Sale Price | Title Company |
|---|---|---|---|
| Martinez Jeanette | $300,000 | Multiple | |
| Alvarez Daniel | -- | -- | |
| Alvarez Daniel | $195,000 | -- |
Source: Public Records
Mortgage History
| Date | Status | Borrower | Loan Amount |
|---|---|---|---|
| Previous Owner | Martinez Jeanette | $285,000 | |
| Previous Owner | Alvarez Daniel | $205,000 | |
| Previous Owner | Alvarez Daniel | $179,448 |
Source: Public Records
Tax History Compared to Growth
Tax History
| Year | Tax Paid | Tax Assessment Tax Assessment Total Assessment is a certain percentage of the fair market value that is determined by local assessors to be the total taxable value of land and additions on the property. | Land | Improvement |
|---|---|---|---|---|
| 2024 | $5,423 | $32,000 | $6,993 | $25,007 |
| 2023 | $5,265 | $29,000 | $5,670 | $23,330 |
| 2022 | $5,265 | $29,000 | $5,670 | $23,330 |
| 2021 | $5,166 | $29,003 | $5,673 | $23,330 |
| 2020 | $4,916 | $25,155 | $4,725 | $20,430 |
| 2019 | $4,993 | $28,264 | $4,725 | $23,539 |
| 2018 | $4,907 | $28,264 | $4,725 | $23,539 |
| 2017 | $4,426 | $23,923 | $4,158 | $19,765 |
| 2016 | $4,294 | $23,923 | $4,158 | $19,765 |
| 2015 | $3,905 | $23,923 | $4,158 | $19,765 |
| 2014 | $3,512 | $21,484 | $3,780 | $17,704 |
| 2013 | $3,432 | $21,484 | $3,780 | $17,704 |
Source: Public Records
Map
Nearby Homes
- 2939 N Lotus Ave
- 3036 N Long Ave
- 3036 N Luna Ave
- 5534 W Barry Ave
- 5335 W Barry Ave
- 5435 W Melrose St
- 5303 W George St
- 5244 W Barry Ave
- 5243 W Oakdale Ave
- 5254 W Wolfram St
- 2859 N Mango Ave
- 5505 W Parker Ave
- 5434 W School St
- 3043 N Laramie Ave Unit 2
- 3045 N Laramie Ave Unit 2
- 4918-22 W Diversey Ave
- 2735 N Mango Ave
- 5233 W Parker Ave
- 5330 W Drummond Place
- 2714 N Mango Ave
- 3007 N Linder Ave
- 3001 N Linder Ave
- 3011 N Linder Ave
- 3013 N Linder Ave
- 3017 N Linder Ave
- 5453 W Wellington Ave
- 3004 N Lotus Ave
- 3004 N Lotus Ave
- 5434 W Wellington Ave Unit 1
- 3006 N Lotus Ave
- 3019 N Linder Ave
- 3010 N Lotus Ave
- 3012 N Lotus Ave
- 3023 N Linder Ave
- 2951 N Linder Ave
- 3010 N Linder Ave
- 3004 N Linder Ave
- 3000 N Linder Ave
- 3000 N Linder Ave
- 3006 N Linder Ave