3005 N Monitor Ave Chicago, IL 60634
Belmont Central NeighborhoodEstimated Value: $342,000 - $411,349
3
Beds
1
Bath
1,128
Sq Ft
$338/Sq Ft
Est. Value
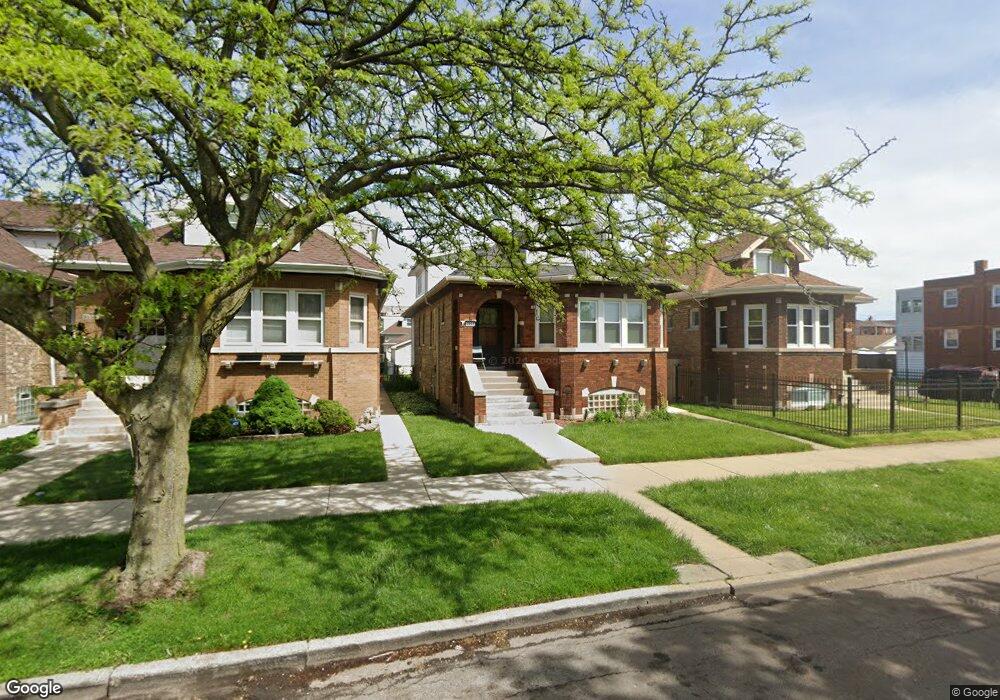
About This Home
This home is located at 3005 N Monitor Ave, Chicago, IL 60634 and is currently estimated at $381,587, approximately $338 per square foot. 3005 N Monitor Ave is a home located in Cook County with nearby schools including Camras Elementary School, Steinmetz College Prep, and Horizon Science Academy-Belmont.
Ownership History
Date
Name
Owned For
Owner Type
Purchase Details
Closed on
Sep 4, 2025
Sold by
Ozman Jaime C
Bought by
Ozman Jaime C
Current Estimated Value
Purchase Details
Closed on
Mar 26, 1996
Sold by
Ozman C
Bought by
Ozman Bernice V
Purchase Details
Closed on
Dec 28, 1995
Sold by
Ozman Bernice V
Bought by
Ozman Bernice V and Ozman Jaime C
Create a Home Valuation Report for This Property
The Home Valuation Report is an in-depth analysis detailing your home's value as well as a comparison with similar homes in the area
Home Values in the Area
Average Home Value in this Area
Purchase History
| Date | Buyer | Sale Price | Title Company |
|---|---|---|---|
| Ozman Jaime C | -- | None Listed On Document | |
| Ozman Bernice V | -- | -- | |
| Ozman Bernice V | -- | -- |
Source: Public Records
Tax History Compared to Growth
Tax History
| Year | Tax Paid | Tax Assessment Tax Assessment Total Assessment is a certain percentage of the fair market value that is determined by local assessors to be the total taxable value of land and additions on the property. | Land | Improvement |
|---|---|---|---|---|
| 2024 | $5,633 | $29,000 | $12,685 | $16,315 |
| 2023 | $5,470 | $30,000 | $10,230 | $19,770 |
| 2022 | $5,470 | $30,000 | $10,230 | $19,770 |
| 2021 | $5,366 | $30,000 | $10,230 | $19,770 |
| 2020 | $4,632 | $23,883 | $5,115 | $18,768 |
| 2019 | $4,705 | $26,835 | $5,115 | $21,720 |
| 2018 | $4,625 | $26,835 | $5,115 | $21,720 |
| 2017 | $3,970 | $21,807 | $4,501 | $17,306 |
| 2016 | $3,870 | $21,807 | $4,501 | $17,306 |
| 2015 | $3,517 | $21,807 | $4,501 | $17,306 |
| 2014 | $3,136 | $19,456 | $4,092 | $15,364 |
| 2013 | $3,063 | $19,456 | $4,092 | $15,364 |
Source: Public Records
Map
Nearby Homes
- 2951 N Austin Ave
- 2851 N Major Ave
- 5836 W Diversey Ave
- 5709 W Melrose St
- 3036 N Luna Ave
- 6014 W Fletcher St
- 5534 W Barry Ave
- 2744 N Marmora Ave
- 2735 N Mango Ave
- 2728 N Mango Ave
- 2714 N Mango Ave
- 2852 N Meade Ave
- 6057 W Melrose St
- 6049 W School St
- 5736 W Roscoe St
- 2632 N Marmora Ave
- 3036 N Long Ave
- 2841 N Melvina Ave
- 5435 W Melrose St
- 5853 W Newport Ave
- 3009 N Monitor Ave
- 3001 N Monitor Ave
- 3011 N Monitor Ave
- 3015 N Monitor Ave
- 2957 N Monitor Ave
- 3019 N Monitor Ave
- 3004 N Menard Ave
- 3006 N Menard Ave
- 3000 N Menard Ave
- 3010 N Menard Ave
- 2955 N Monitor Ave
- 3014 N Menard Ave
- 3004 N Monitor Ave
- 3008 N Monitor Ave
- 5834 W Wellington Ave
- 3018 N Menard Ave
- 2951 N Monitor Ave
- 3021 N Monitor Ave
- 3025 N Monitor Ave
- 3010 N Monitor Ave