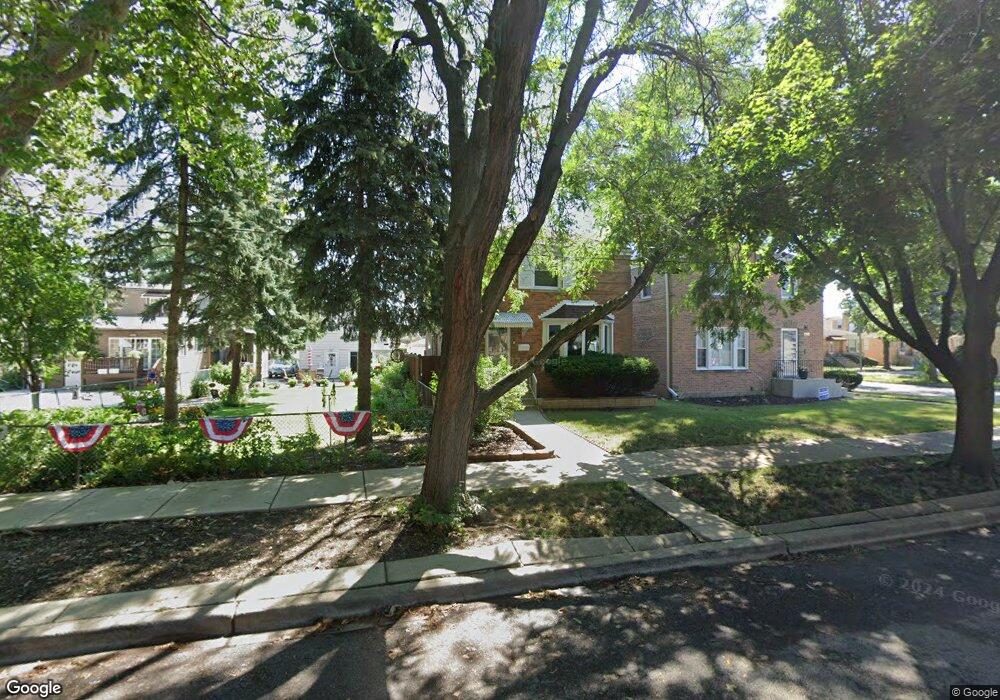
3005 N Nordica Ave Chicago, IL 60634
Montclare NeighborhoodEstimated Value: $368,000 - $434,000
2
Beds
3
Baths
1,214
Sq Ft
$327/Sq Ft
Est. Value
About This Home
This home is located at 3005 N Nordica Ave, Chicago, IL 60634 and is currently estimated at $397,260, approximately $327 per square foot. 3005 N Nordica Ave is a home located in Cook County with nearby schools including Locke J Elementary School, Steinmetz College Prep, and St. Celestine School.
Ownership History
Date
Name
Owned For
Owner Type
Purchase Details
Closed on
Aug 31, 2007
Sold by
Cedeno Wendy and Cedeno Angel
Bought by
Cedeno Wendy T and Cedeno Angel
Current Estimated Value
Home Financials for this Owner
Home Financials are based on the most recent Mortgage that was taken out on this home.
Original Mortgage
$305,000
Outstanding Balance
$186,064
Interest Rate
5.87%
Mortgage Type
New Conventional
Estimated Equity
$211,196
Purchase Details
Closed on
Feb 19, 2001
Sold by
Lozneanu Viorel and Lozneanu Adriana
Bought by
Brown Wendy T and Cedeno Angel
Home Financials for this Owner
Home Financials are based on the most recent Mortgage that was taken out on this home.
Original Mortgage
$237,500
Interest Rate
7.18%
Purchase Details
Closed on
Mar 18, 1997
Sold by
Conwell Hugh
Bought by
Lozneanu Viorel and Lozneanu Adriana
Home Financials for this Owner
Home Financials are based on the most recent Mortgage that was taken out on this home.
Original Mortgage
$111,900
Interest Rate
7.73%
Create a Home Valuation Report for This Property
The Home Valuation Report is an in-depth analysis detailing your home's value as well as a comparison with similar homes in the area
Home Values in the Area
Average Home Value in this Area
Purchase History
| Date | Buyer | Sale Price | Title Company |
|---|---|---|---|
| Cedeno Wendy T | -- | Stewart Title Of Illinois | |
| Brown Wendy T | $250,000 | -- | |
| Lozneanu Viorel | $140,000 | -- |
Source: Public Records
Mortgage History
| Date | Status | Borrower | Loan Amount |
|---|---|---|---|
| Open | Cedeno Wendy T | $305,000 | |
| Closed | Brown Wendy T | $237,500 | |
| Previous Owner | Lozneanu Viorel | $111,900 |
Source: Public Records
Tax History Compared to Growth
Tax History
| Year | Tax Paid | Tax Assessment Tax Assessment Total Assessment is a certain percentage of the fair market value that is determined by local assessors to be the total taxable value of land and additions on the property. | Land | Improvement |
|---|---|---|---|---|
| 2024 | $5,278 | $32,000 | $13,671 | $18,329 |
| 2023 | $5,145 | $25,000 | $11,025 | $13,975 |
| 2022 | $5,145 | $25,000 | $11,025 | $13,975 |
| 2021 | $5,030 | $25,000 | $11,025 | $13,975 |
| 2020 | $5,481 | $24,588 | $5,512 | $19,076 |
| 2019 | $5,554 | $27,627 | $5,512 | $22,115 |
| 2018 | $5,460 | $27,627 | $5,512 | $22,115 |
| 2017 | $4,681 | $21,731 | $4,851 | $16,880 |
| 2016 | $4,355 | $21,731 | $4,851 | $16,880 |
| 2015 | $3,984 | $21,731 | $4,851 | $16,880 |
| 2014 | $3,901 | $21,011 | $4,410 | $16,601 |
| 2013 | $3,824 | $21,011 | $4,410 | $16,601 |
Source: Public Records
Map
Nearby Homes
- 3105 N Nordica Ave
- 6938 W Barry Ave
- 6934 W Oakdale Ave
- 2930 N New England Ave
- 2846 N Sayre Ave
- 7201 W Wellington Ave Unit D1
- 2919 N Harlem Ave Unit 411
- 2930 N Harlem Ave Unit 5D
- 6964 W Diversey Ave Unit 6
- 6944 W Diversey Ave Unit 3S
- 7004 W School St
- 3011 N Oak Park Ave
- 3129 N Oconto Ave
- 3312 N New England Ave
- 6736 W Belmont Ave
- 2714 N New England Ave
- 3231 N Octavia Ave
- 3121 N Normandy Ave
- 2659 N Mont Clare Ave
- 3247 N Rutherford Ave
- 3001 N Nordica Ave
- 3009 N Nordica Ave
- 3011 N Nordica Ave
- 3015 N Nordica Ave
- 3247 Nora
- 2958 N Nora Ave
- 3017 N Nordica Ave
- 2959 N Nora Ave
- 3000 N Sayre Ave
- 3008 N Sayre Ave
- 2954 N Nora Ave
- 3010 N Sayre Ave
- 3019 N Nordica Ave
- 3019 N Nordica Ave
- 2955 N Nora Ave
- 3014 N Sayre Ave Unit 2
- 2959 N Nordica Ave
- 3004 N Nordica Ave
- 3000 N Nordica Ave
- 3008 N Nordica Ave Unit 1