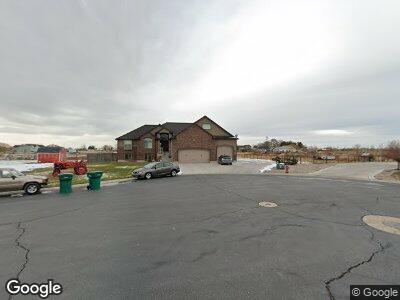
3005 S 2550 W West Haven, UT 84401
Estimated Value: $701,000 - $997,165
6
Beds
3
Baths
3,900
Sq Ft
$215/Sq Ft
Est. Value
About This Home
This home is located at 3005 S 2550 W, West Haven, UT 84401 and is currently estimated at $840,041, approximately $215 per square foot. 3005 S 2550 W is a home located in Weber County with nearby schools including Kanesville Elementary School, Rocky Mountain Junior High School, and Fremont High School.
Ownership History
Date
Name
Owned For
Owner Type
Purchase Details
Closed on
Jan 24, 2018
Sold by
Poagano Kelly S
Bought by
Roper Jacob M and Roper Rebekah
Current Estimated Value
Home Financials for this Owner
Home Financials are based on the most recent Mortgage that was taken out on this home.
Original Mortgage
$424,100
Outstanding Balance
$362,757
Interest Rate
3.93%
Mortgage Type
New Conventional
Estimated Equity
$477,284
Purchase Details
Closed on
Feb 28, 2014
Sold by
Scott Lindsay Construction Inc
Bought by
Pagano Kelly S
Home Financials for this Owner
Home Financials are based on the most recent Mortgage that was taken out on this home.
Original Mortgage
$337,036
Interest Rate
4.38%
Mortgage Type
New Conventional
Purchase Details
Closed on
Sep 12, 2013
Sold by
Demille Enterprises
Bought by
Scott Linday Construction Inc
Create a Home Valuation Report for This Property
The Home Valuation Report is an in-depth analysis detailing your home's value as well as a comparison with similar homes in the area
Home Values in the Area
Average Home Value in this Area
Purchase History
| Date | Buyer | Sale Price | Title Company |
|---|---|---|---|
| Roper Jacob M | -- | Mountain View Title | |
| Pagano Kelly S | -- | Intermountain Title | |
| Scott Linday Construction Inc | -- | Intermountain Title |
Source: Public Records
Mortgage History
| Date | Status | Borrower | Loan Amount |
|---|---|---|---|
| Open | Roper Jacob M | $424,100 | |
| Previous Owner | Pagano Kelly S | $337,036 |
Source: Public Records
Tax History Compared to Growth
Tax History
| Year | Tax Paid | Tax Assessment Tax Assessment Total Assessment is a certain percentage of the fair market value that is determined by local assessors to be the total taxable value of land and additions on the property. | Land | Improvement |
|---|---|---|---|---|
| 2024 | $5,030 | $472,998 | $93,253 | $379,745 |
| 2023 | $4,776 | $447,700 | $82,156 | $365,544 |
| 2022 | $4,701 | $452,650 | $79,457 | $373,193 |
| 2021 | $4,820 | $791,000 | $104,045 | $686,955 |
| 2020 | $4,450 | $667,000 | $89,116 | $577,884 |
| 2019 | $4,563 | $649,000 | $90,300 | $558,700 |
| 2018 | $3,436 | $460,000 | $70,146 | $389,854 |
| 2017 | $3,321 | $435,000 | $72,387 | $362,613 |
| 2016 | $2,931 | $208,117 | $31,113 | $177,004 |
| 2015 | $2,852 | $201,554 | $31,113 | $170,441 |
| 2014 | $2,142 | $143,957 | $31,113 | $112,844 |
Source: Public Records
Map
Nearby Homes
- 2861 W 2875 S
- 3243 S 2400 W
- 3160 W 3125 S Unit 19
- 2878 2850 S
- 2340 W 3225 S
- 3158 S 2985 W
- 2390 W Jade Way Unit 2
- 2265 W 3200 S
- 2466 W 3375 S
- 2515 W 3375 S
- 2252 W 3250 S
- 3348 S Kate Ln Unit 16
- 2199 W 3150 S
- 3286 S 2275 W
- 3385 S 2700 W
- 2370 James Way Unit E17
- 2727 S 2300 W Unit 242
- 3058 S 2150 W
- 2448 W Anne Ave
- 3417 2730 S
- 3005 S 2550 W
- 3005 S 2550 W Unit 3
- 3045 S 2550 W
- 3045 S 2550 W Unit 6
- 3045 S 2550 W Unit 6
- 2999 S 2550 W
- 2999 S 2550 W Unit TWO
- 3042 S 2550 W
- 3000 S 2550 W
- 2626 W 3075 S
- 2626 W 3075 S Unit 3
- 3055 S 2550 W
- 2596 W 3075 S
- 2596 W 3075 S Unit 4
- 3052 S 2550 W
- 2952 S 2700 W
- 2652 W 3075 S
- 2652 W 3075 S Unit 2
- 2593 W 3075 S
- 2990 S 2700 W