Estimated Value: $526,000 - $564,000
4
Beds
3
Baths
3,408
Sq Ft
$160/Sq Ft
Est. Value
About This Home
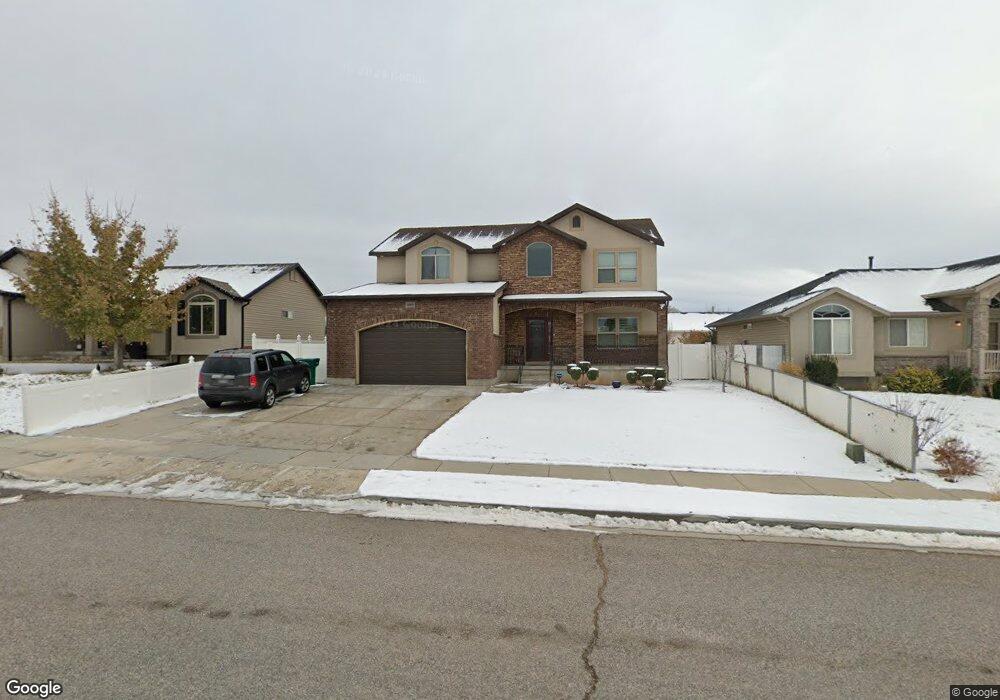
This home is located at 3005 W 4700 S, Roy, UT 84067 and is currently estimated at $546,019, approximately $160 per square foot. 3005 W 4700 S is a home located in Weber County with nearby schools including Midland School, Sand Ridge Junior High School, and Roy High School.
Ownership History
Date
Name
Owned For
Owner Type
Purchase Details
Closed on
Dec 11, 2020
Sold by
Vuong Ich and Vuong Tina
Bought by
Ich Vuong And Tina Vuong Family Trust
Current Estimated Value
Purchase Details
Closed on
Dec 27, 2010
Sold by
Federal National Mortgage Association
Bought by
Vuong Ich and Vuong Tina
Home Financials for this Owner
Home Financials are based on the most recent Mortgage that was taken out on this home.
Original Mortgage
$193,500
Outstanding Balance
$128,014
Interest Rate
4.17%
Mortgage Type
New Conventional
Estimated Equity
$418,005
Purchase Details
Closed on
Aug 13, 2010
Sold by
Kay Lorraine and Kay Rockie J
Bought by
Federal National Mortgage Association
Purchase Details
Closed on
Mar 4, 2008
Sold by
Rock Hard Construction Inc
Bought by
Kay Rockie J and Kay Lorraine
Create a Home Valuation Report for This Property
The Home Valuation Report is an in-depth analysis detailing your home's value as well as a comparison with similar homes in the area
Home Values in the Area
Average Home Value in this Area
Purchase History
| Date | Buyer | Sale Price | Title Company |
|---|---|---|---|
| Ich Vuong And Tina Vuong Family Trust | -- | None Available | |
| Vuong Ich | $215,000 | Us Title Insurance Agency | |
| Federal National Mortgage Association | $249,972 | None Available | |
| Kay Rockie J | -- | None Available |
Source: Public Records
Mortgage History
| Date | Status | Borrower | Loan Amount |
|---|---|---|---|
| Open | Vuong Ich | $193,500 |
Source: Public Records
Tax History Compared to Growth
Tax History
| Year | Tax Paid | Tax Assessment Tax Assessment Total Assessment is a certain percentage of the fair market value that is determined by local assessors to be the total taxable value of land and additions on the property. | Land | Improvement |
|---|---|---|---|---|
| 2025 | $3,301 | $535,604 | $141,851 | $393,753 |
| 2024 | $3,219 | $526,000 | $141,851 | $384,149 |
| 2023 | $2,925 | $476,000 | $130,503 | $345,497 |
| 2022 | $3,256 | $549,000 | $110,803 | $438,197 |
| 2021 | $2,681 | $409,000 | $85,992 | $323,008 |
| 2020 | $2,588 | $363,000 | $85,992 | $277,008 |
| 2019 | $2,589 | $343,000 | $59,985 | $283,015 |
| 2018 | $2,484 | $310,000 | $53,080 | $256,920 |
| 2017 | $2,460 | $289,000 | $53,080 | $235,920 |
| 2016 | $2,366 | $149,577 | $35,028 | $114,549 |
| 2015 | $2,105 | $135,843 | $23,890 | $111,953 |
| 2014 | $2,125 | $135,843 | $23,890 | $111,953 |
Source: Public Records
Map
Nearby Homes
- 3014 W 4750 S
- 4635 S 2950 W
- 3046 W 4850 S
- 4891 S 2875 W
- 4918 S 2925 W
- 5003 S 2825 W
- 5009 S 2925 W
- 4875 S 2675 W
- 4919 S 2675 W
- 5063 S 2825 W
- 3084 W 4375 S
- 5056 S 2800 W
- 2816 W 4400 S
- 4510 Stone Creek Rd Unit F
- 4440 Stone Creek Rd Unit 2E
- 5007 S 2675 W
- 2979 W 4275 S
- 1952 W 5450 S
- 5173 S 2825 W
- 2802 W 4375 S
- 3001 W 4700 S
- 3006 W 4750 S
- 4713 S 2950 W
- 4727 S 2950 W Unit 52
- 4727 S 2950 W
- 4710 S 3025 W
- 4726 S 3025 W
- 3004 W 4700 S
- 3008 W 4700 S
- 3012 W 4700 S
- 3022 W 4750 S
- 2980 W 4700 S Unit 34
- 4745 S 2950 W Unit 50
- 4739 S 2950 W
- 2998 W 4750 S
- 3018 W 4700 S
- 2966 W 4700 S
- 3001 W 4650 S
- 4757 S 2950 W
- 2989 W 4650 S