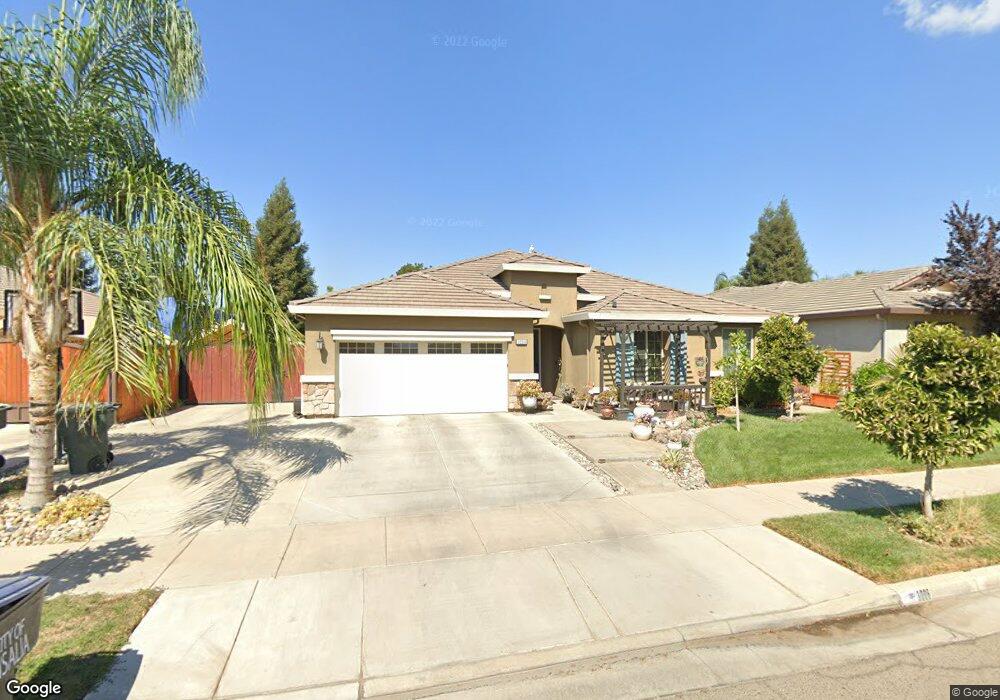
3006 W Perez Ave Visalia, CA 93291
Northwest Visalia NeighborhoodEstimated Value: $508,625 - $558,000
4
Beds
2
Baths
2,386
Sq Ft
$225/Sq Ft
Est. Value
About This Home
This home is located at 3006 W Perez Ave, Visalia, CA 93291 and is currently estimated at $537,656, approximately $225 per square foot. 3006 W Perez Ave is a home located in Tulare County with nearby schools including Manuel F. Hernandez, Green Acres Middle School, and Redwood High School.
Ownership History
Date
Name
Owned For
Owner Type
Purchase Details
Closed on
Aug 24, 2018
Sold by
Kiaosouvath Vinath
Bought by
Kiaosouvath Phiangphak S and Saechao Chio H
Current Estimated Value
Home Financials for this Owner
Home Financials are based on the most recent Mortgage that was taken out on this home.
Original Mortgage
$277,600
Outstanding Balance
$241,084
Interest Rate
4.5%
Mortgage Type
New Conventional
Estimated Equity
$296,572
Purchase Details
Closed on
Mar 28, 2012
Sold by
Woodside 07N Lp
Bought by
Saechao Chio H and Kiasouvath Phiangphak S
Home Financials for this Owner
Home Financials are based on the most recent Mortgage that was taken out on this home.
Original Mortgage
$249,055
Interest Rate
3.83%
Mortgage Type
FHA
Purchase Details
Closed on
Aug 12, 2011
Sold by
Woodside 05N Lp
Bought by
Woodside 07N Lp
Create a Home Valuation Report for This Property
The Home Valuation Report is an in-depth analysis detailing your home's value as well as a comparison with similar homes in the area
Home Values in the Area
Average Home Value in this Area
Purchase History
| Date | Buyer | Sale Price | Title Company |
|---|---|---|---|
| Kiaosouvath Phiangphak S | -- | First American Title Co | |
| Saechao Chio H | $256,000 | Placer Title Company | |
| Woodside 07N Lp | -- | None Available |
Source: Public Records
Mortgage History
| Date | Status | Borrower | Loan Amount |
|---|---|---|---|
| Open | Kiaosouvath Phiangphak S | $277,600 | |
| Closed | Saechao Chio H | $249,055 |
Source: Public Records
Tax History Compared to Growth
Tax History
| Year | Tax Paid | Tax Assessment Tax Assessment Total Assessment is a certain percentage of the fair market value that is determined by local assessors to be the total taxable value of land and additions on the property. | Land | Improvement |
|---|---|---|---|---|
| 2025 | $3,688 | $334,419 | $91,612 | $242,807 |
| 2024 | $3,688 | $327,863 | $89,816 | $238,047 |
| 2023 | $3,445 | $321,435 | $88,055 | $233,380 |
| 2022 | $3,399 | $315,133 | $86,329 | $228,804 |
| 2021 | $3,402 | $308,954 | $84,636 | $224,318 |
| 2020 | $3,381 | $305,786 | $83,768 | $222,018 |
| 2019 | $3,288 | $299,790 | $82,125 | $217,665 |
| 2018 | $3,084 | $282,048 | $71,754 | $210,294 |
| 2017 | $3,047 | $276,518 | $70,347 | $206,171 |
| 2016 | $2,999 | $271,096 | $68,968 | $202,128 |
| 2015 | $2,963 | $267,024 | $67,932 | $199,092 |
| 2014 | $2,963 | $261,793 | $66,601 | $195,192 |
Source: Public Records
Map
Nearby Homes
- 3010 W Ceres Ave
- 3024 W Elowin Ave
- 5035 W Sunnyview Ct Unit Syc57
- 2336 N University St
- 3137 W Delaware Ct
- 2108 N Woodland St
- 3615 W Sunnyview Ave
- 3530 W Harold Ave
- 3633 W Harold Ave
- 3542 W Oakridge Ave
- 7930 W Sunnyview Ave
- 3103 W Wren Ave
- 3833 W Vine Ave
- 3842 W Buena Vista Ave
- 2536 W Stewart Ave
- 2326 N Fontana St
- 2313 N Fontana St
- 2320 N Fontana St
- 2319 N Fontana St
- 2314 N Fontana St
- 2956 W Perez Ave
- 3016 W Perez Ave
- 3007 W Clinton Ct
- 2957 W Clinton Ct
- 3017 W Clinton Ct
- 2946 W Perez Ave
- 3026 W Perez Ave
- 3005 W Perez Ave
- 2955 W Perez Ave
- 3015 W Perez Ave
- 2947 W Clinton Ct
- 3025 W Clinton Ct
- 3032 W Perez Ave
- 2934 W Perez Ave
- 3027 W Perez Ave
- 3031 W Clinton Ct
- 2933 W Clinton Ct
- 2937 W Perez Ave
- 3033 W Perez Ave
- 3002 W Vine Ave