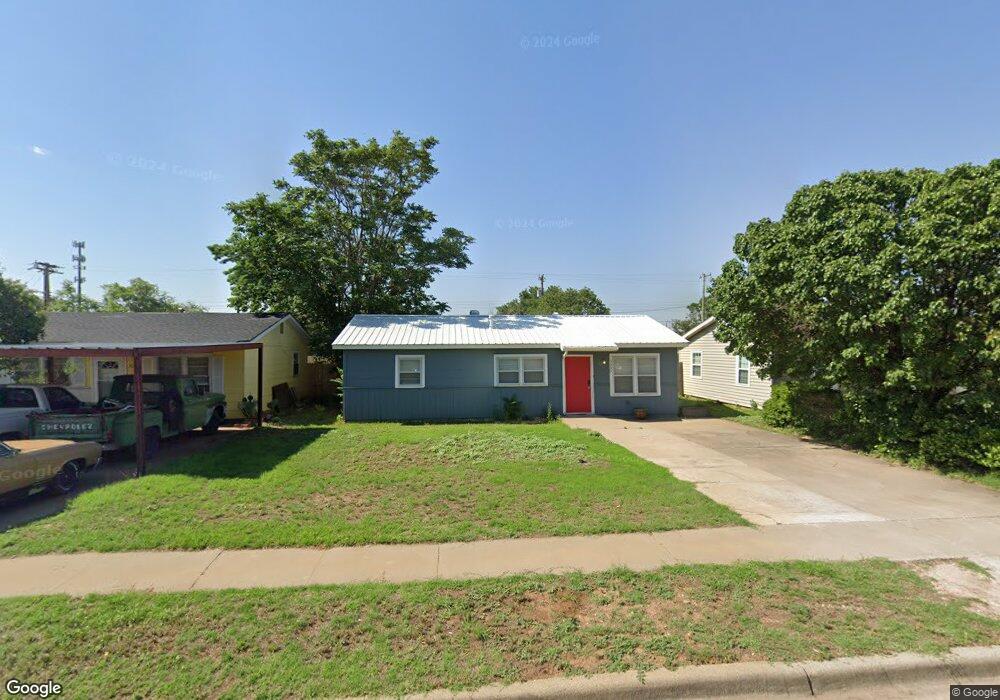
3007 2nd Place Lubbock, TX 79415
Arnett Benson NeighborhoodEstimated Value: $68,000 - $80,181
3
Beds
1
Bath
912
Sq Ft
$81/Sq Ft
Est. Value
About This Home
This home is located at 3007 2nd Place, Lubbock, TX 79415 and is currently estimated at $74,295, approximately $81 per square foot. 3007 2nd Place is a home located in Lubbock County with nearby schools including McWhorter Elementary School, Cavazos Middle School, and Lubbock High School.
Ownership History
Date
Name
Owned For
Owner Type
Purchase Details
Closed on
Oct 23, 2019
Sold by
Wilmington Savings Fund Society Fsb
Bought by
Baxa James Patrick and Baxa Traci Lynn
Current Estimated Value
Home Financials for this Owner
Home Financials are based on the most recent Mortgage that was taken out on this home.
Original Mortgage
$60,000
Outstanding Balance
$52,776
Interest Rate
3.7%
Mortgage Type
Future Advance Clause Open End Mortgage
Estimated Equity
$21,519
Purchase Details
Closed on
Dec 27, 2011
Sold by
White Mathew and Puente Delfina
Bought by
Puente Delfina
Purchase Details
Closed on
Feb 8, 2011
Sold by
Puente Delfina
Bought by
Puente Delfina and White Mathew
Purchase Details
Closed on
Aug 28, 1984
Bought by
Puente Delfina
Create a Home Valuation Report for This Property
The Home Valuation Report is an in-depth analysis detailing your home's value as well as a comparison with similar homes in the area
Home Values in the Area
Average Home Value in this Area
Purchase History
| Date | Buyer | Sale Price | Title Company |
|---|---|---|---|
| Baxa James Patrick | -- | None Available | |
| Wilmington Savings Fund Society Fsb | -- | None Available | |
| Puente Delfina | -- | None Available | |
| Puente Delfina | -- | None Available | |
| Puente Delfina | -- | -- |
Source: Public Records
Mortgage History
| Date | Status | Borrower | Loan Amount |
|---|---|---|---|
| Open | Baxa James Patrick | $60,000 |
Source: Public Records
Tax History Compared to Growth
Tax History
| Year | Tax Paid | Tax Assessment Tax Assessment Total Assessment is a certain percentage of the fair market value that is determined by local assessors to be the total taxable value of land and additions on the property. | Land | Improvement |
|---|---|---|---|---|
| 2025 | $1,235 | $63,259 | $15,500 | $47,759 |
| 2024 | $1,235 | $68,019 | $2,250 | $65,769 |
| 2023 | $1,114 | $59,949 | $2,250 | $57,699 |
| 2022 | $1,168 | $57,678 | $2,250 | $55,428 |
| 2021 | $1,084 | $50,620 | $2,250 | $48,370 |
| 2020 | $957 | $44,024 | $2,250 | $41,774 |
| 2019 | $988 | $44,024 | $2,250 | $41,774 |
| 2018 | $902 | $40,135 | $2,250 | $37,885 |
| 2017 | $821 | $36,486 | $2,250 | $34,236 |
| 2016 | $841 | $37,371 | $1,250 | $36,121 |
| 2015 | $166 | $37,380 | $1,250 | $36,130 |
| 2014 | $166 | $34,431 | $1,250 | $33,181 |
Source: Public Records
Map
Nearby Homes