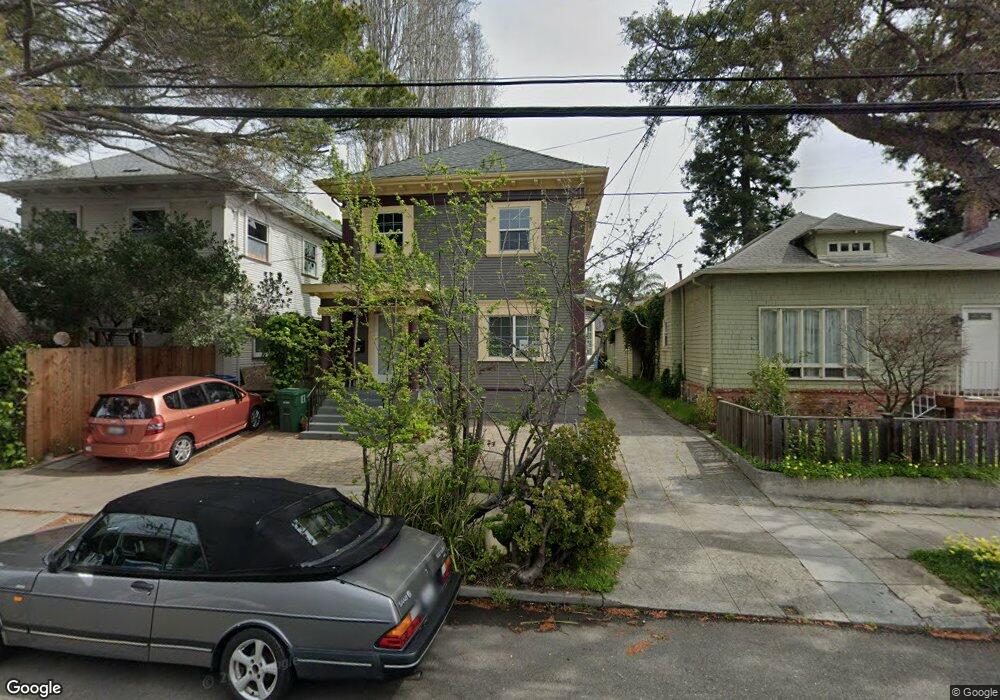
3007 Fulton St Berkeley, CA 94705
South Berkeley NeighborhoodEstimated Value: $1,115,000 - $1,354,000
3
Beds
2
Baths
1,820
Sq Ft
$667/Sq Ft
Est. Value
About This Home
This home is located at 3007 Fulton St, Berkeley, CA 94705 and is currently estimated at $1,214,667, approximately $667 per square foot. 3007 Fulton St is a home located in Alameda County with nearby schools including Malcolm X Elementary School, Emerson Elementary School, and John Muir Elementary School.
Ownership History
Date
Name
Owned For
Owner Type
Purchase Details
Closed on
Aug 19, 2010
Sold by
Bank Of America National Association
Bought by
Dedomenico Plinio and Silva Susana
Current Estimated Value
Purchase Details
Closed on
Dec 1, 2009
Sold by
Willis Hermelinda
Bought by
Bank Of America National Association
Purchase Details
Closed on
Nov 18, 2003
Sold by
Jones Arinthia Lynn
Bought by
Willis Hermelinda
Home Financials for this Owner
Home Financials are based on the most recent Mortgage that was taken out on this home.
Original Mortgage
$75,000
Interest Rate
5.97%
Mortgage Type
Credit Line Revolving
Purchase Details
Closed on
Aug 24, 2001
Sold by
Jones Arinthia Lynn and Willis Victoria Raquel
Bought by
Jones Arinthia Lynn and Willis Hermelinda
Purchase Details
Closed on
Feb 10, 1997
Sold by
Willis Hermelinda
Bought by
Jones Arinthia Lynn and Willis Victoria Raquel
Create a Home Valuation Report for This Property
The Home Valuation Report is an in-depth analysis detailing your home's value as well as a comparison with similar homes in the area
Home Values in the Area
Average Home Value in this Area
Purchase History
| Date | Buyer | Sale Price | Title Company |
|---|---|---|---|
| Dedomenico Plinio | $360,000 | Lawyers Title Co | |
| Bank Of America National Association | $370,000 | Accommodation | |
| Willis Hermelinda | $37,500 | Placer Title Company | |
| Jones Arinthia Lynn | -- | -- | |
| Jones Arinthia Lynn | -- | -- |
Source: Public Records
Mortgage History
| Date | Status | Borrower | Loan Amount |
|---|---|---|---|
| Previous Owner | Willis Hermelinda | $75,000 |
Source: Public Records
Tax History
| Year | Tax Paid | Tax Assessment Tax Assessment Total Assessment is a certain percentage of the fair market value that is determined by local assessors to be the total taxable value of land and additions on the property. | Land | Improvement |
|---|---|---|---|---|
| 2025 | $10,785 | $461,195 | $138,358 | $322,837 |
| 2024 | $10,785 | $452,155 | $135,646 | $316,509 |
| 2023 | $10,421 | $443,292 | $132,987 | $310,305 |
| 2022 | $10,056 | $434,601 | $130,380 | $304,221 |
| 2021 | $10,038 | $426,081 | $127,824 | $298,257 |
| 2020 | $9,423 | $421,714 | $126,514 | $295,200 |
| 2019 | $8,965 | $413,448 | $124,034 | $289,414 |
| 2018 | $9,246 | $405,344 | $121,603 | $283,741 |
| 2017 | $8,902 | $397,400 | $119,220 | $278,180 |
| 2016 | $8,515 | $389,610 | $116,883 | $272,727 |
| 2015 | $8,367 | $383,760 | $115,128 | $268,632 |
| 2014 | $8,419 | $376,242 | $112,872 | $263,370 |
Source: Public Records
Map
Nearby Homes
- 2243 Ashby Ave
- 2923 Wheeler St
- 3046 Deakin St
- 2110 Ashby Ave
- 2124 Prince St
- 2917 Telegraph Ave
- 2057 Emerson St
- 629 66th St
- 2935 Florence St
- 6445 Irwin Ct
- 6555 Shattuck Ave
- 2319 Ward St
- 556 Alcatraz Ave
- 6446 Colby St
- 2477 Prince St
- 2702 Dana St
- 667 & 667A Alcatraz Ave
- 667 Alcatraz Ave
- 6320 Shattuck Ave
- 6300 Shattuck Ave Unit 1
Your Personal Tour Guide
Ask me questions while you tour the home.